Calculating your organisation's carbon footprint is a crucial step towards understanding and reducing your environmental impact. A fundamental part of this process involves converting your activity data, like energy consumed, materials used, or kilometres travelled, into greenhouse gas (GHG) emissions. This conversion relies on emission factors, but where do these factors come from, and how do you ensure you're using the right ones for an accurate result?
Understanding emission factor databases is key. As outlined in the broader guide to carbon footprint accounting, selecting appropriate factors is essential for reliable calculations. This article dives deeper into the world of emission factors, exploring their sources, selection criteria, and impact on the accuracy of your carbon footprint.
What are emission factors and why do they matter?
An emission factor is essentially a ratio that quantifies the amount of greenhouse gas emissions released into the atmosphere per unit of a specific activity. For example:
- Kilograms of CO₂ equivalent (CO₂e) emitted per kilowatt-hour (kWh) of electricity consumed.
- Kilograms of CO₂e emitted per litre of diesel fuel burned.
- Kilograms of CO₂e emitted per tonne-kilometre of goods transported by truck.
These factors are the backbone of most carbon footprint calculations, particularly when using activity-based methods outlined in standards like the GHG Protocol. Without reliable emission factors, you cannot accurately translate your operational data into meaningful emissions figures. Choosing the right factor directly impacts the credibility and usefulness of your entire carbon assessment, influencing everything from reduction strategies to compliance reporting. For a foundational understanding of different calculation approaches, see our guide on quantifying sustainability: a guide to carbon accounting.
Where do emission factors come from? Major database sources
Emission factors aren't pulled out of thin air; they are derived from detailed scientific research, measurements, and modelling. They are compiled and published in various emission factor databases. These databases can generally be categorized as follows:
Governmental Databases
Many national government environmental agencies publish regularly updated emission factors specific to their country or region. These are often freely available and widely used for national inventory reporting and corporate calculations within that jurisdiction.
- CO2Emissiefactoren (NL): This database via co2emissiefactoren.nl, is a collaboration between four organisations and the Dutch government. Every year this list is updated by a broad panel of experts based on the most recent insights. It can be used for national and international emission monitoring.
- DEFRA (UK): The Department for Environment, Food & Rural Affairs provides comprehensive factors for UK-based and international activities, covering fuels, electricity, transport, waste, and more.
- EPA (USA): The Environmental Protection Agency offers various tools and data sources, including the eGRID database for electricity grid factors and the GHG Emission Factors Hub.
- Other National/Regional Bodies: Many other countries (e.g., Germany's UBA, Australia's NGA Factors) provide similar resources.
👍Pros: Often free, region-specific, widely accepted for national reporting.
👎Cons: May lack granularity for specific processes or global supply chains, updates can be infrequent.
Commercial Databases (LCI Databases)
These are extensive, often subscription-based databases primarily developed for Life Cycle Assessment (LCA) but widely used for detailed carbon footprinting, especially for Scope 3. They contain thousands of factors for materials, processes, transport, and energy across various geographies and technologies.
- Ecoinvent: A leading global Life Cycle Inventory (LCI database) known for its comprehensive scope, detailed process data, and transparent methodology. It's a common source within carbon accounting software.
- GaBi Databases: Another major commercial LCI database provided by Sphera, often integrated into LCA and sustainability software platforms.
👍Pros: Highly detailed, global coverage, process-specific data, regular updates.
👎Cons: Usually require paid licenses, can be complex to navigate.
Academic & Research Databases
Research institutions sometimes publish specialised databases, often focusing on specific sectors or incorporating complex economic models (like input-output databases, e.g., Exiobase, GTAP) which can be useful for spend-based analysis or broad Scope 3 screening.
👍Pros: Can offer cutting-edge research or specific sectoral insights.
👎Cons: May be less standardized, harder to access, or less frequently updated than commercial/governmental sources.
Industry-Specific Databases
Some industry associations compile and publish emission factors relevant to their specific sector (e.g., IAI for aluminium, ICAO for aviation).
👍Pros: Highly relevant to specific materials or processes within that sector.
👎Cons: Coverage is limited to that industry.
Choosing the right emission factor: key selection criteria
With various GHG emission factors sources available, selecting the most appropriate one is critical for data quality and accuracy. The GHG Protocol and other standards recommend considering the following criteria:
- Geographical relevance: Does the factor reflect the location where the activity occurs? Electricity grid factors, for instance, vary significantly by country and even region. Using a generic global factor when a specific local one is available reduces accuracy.
- Technological specificity: Does the factor represent the specific technology or process used? A factor for road freight should ideally match the type of truck and fuel used.
- Time period / vintage: Is the factor representative of the period for which you are calculating emissions? Factors change over time due to technological improvements (e.g., grid decarbonization, fuel efficiency). Use factors relevant to your reporting year.
- Data quality & uncertainty: Reputable databases often provide information on the factor's quality, methodology, and uncertainty range. Prioritize factors with higher quality ratings and lower uncertainty where possible. Understanding this is crucial when choosing the right carbon accounting method.
The hierarchy of preference: getting the most accurate results
When multiple factors could potentially apply, there's a generally accepted hierarchy to prioritize accuracy:
- Supplier-Specific Data: The best source is often direct data from your suppliers (e.g., the exact emissions factor for the specific electricity tariff you purchase, or product carbon footprints from material suppliers). This is particularly relevant for Scope 3 emissions. Engaging suppliers for this data is key, though it can be challenging.
- Process-Specific Factors: Use factors that closely match the specific activity or technology (e.g., a factor for natural gas combustion in a specific type of boiler). High-quality LCI databases often provide this level of detail.
- Industry-Average Factors: If process-specific factors aren't available, use reputable factors representing the average for that industry or activity type in your region (e.g., average emission factor for road freight in the EU).
- Generic/Proxy Factors: Use more general factors (e.g., global averages, factors based on financial spend) only when more specific data is unavailable. These typically have higher uncertainty.
Following this hierarchy helps ensure your footprint is as accurate and representative as possible, forming a solid basis for reduction efforts.
How factor choice impacts your carbon footprint results
Consider a simple example: calculating emissions from electricity use.
- Using a generic global average factor might give you one result.
- Using a country-specific factor (e.g., from DEFRA or EPA) reflecting the national grid mix will likely give a different, more accurate result for your location.
- Using a supplier-specific factor for a certified renewable energy tariff could drastically lower the calculated emissions for that consumption, reflecting your specific purchasing decisions (market-based approach).
This illustrates how seemingly small choices in emission factor selection can significantly alter your final carbon footprint figures, impacting hotspot identification and the perceived effectiveness of reduction initiatives. This is a core part of the 3 step plan for calculating your Carbon Footprint.
Streamlining factor selection with tools
Managing hundreds or even thousands of activities and finding the appropriate, up-to-date emission factors can be complex and time-consuming. This is where specialized software comes in.
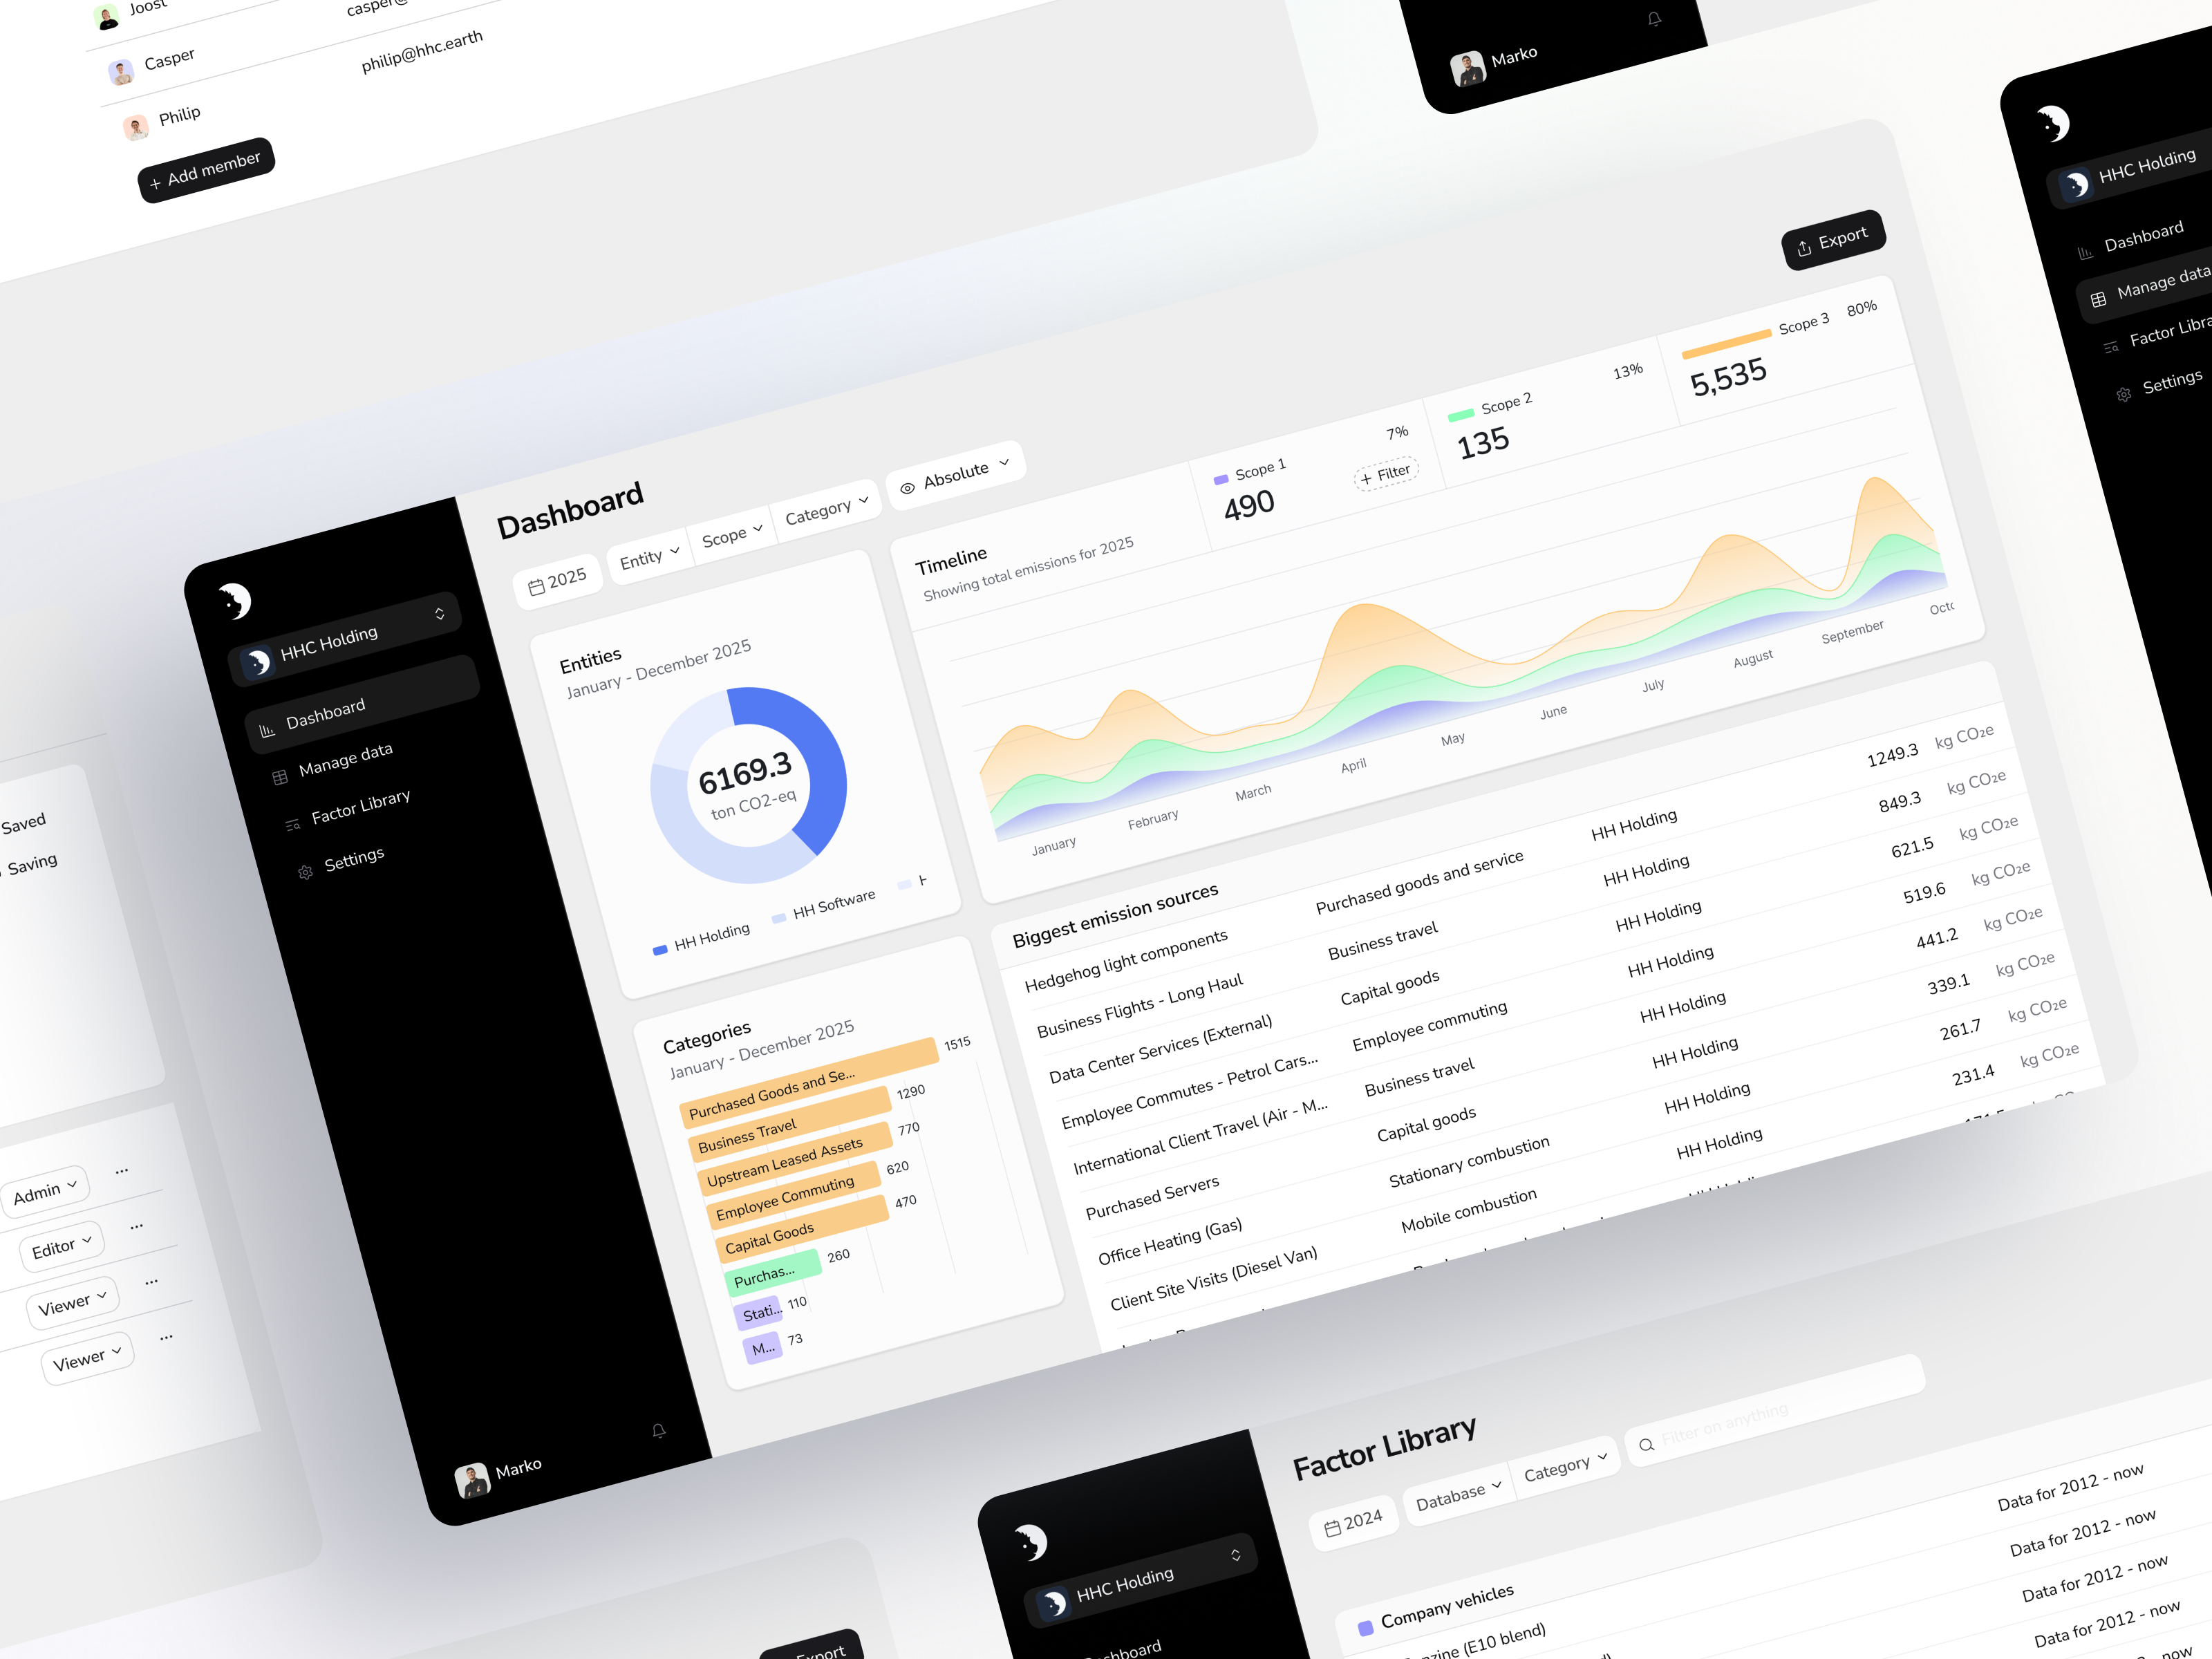
The Hedgehog Carbon Platform, for example, integrates reputable emission factor databases (including governmental sources and options drawing from LCI data like Ecoinvent) and automatically applies geographically and temporally relevant factors based on your activity data input. This streamlines the process, reduces manual error, and ensures consistency according to standards like the GHG Protocol. Explore how tools can help via our free business carbon calculator or learn more about the full Carbon Platform.
Conclusion: clarity in your calculations
Emission factors are the critical link between your business activities and their climate impact. Understanding the different types of emission factor databases, applying careful emission factor selection criteria (geography, technology, time, quality), and following a hierarchy of preference are essential for achieving an accurate and credible carbon footprint.
While governmental databases provide a solid foundation, commercial LCI databases offer greater granularity, especially for complex supply chains. Remember that the factors you choose directly influence your results, so investing time in selecting the most appropriate ones, or utilizing tools that manage this complexity, is vital for meaningful carbon accounting and effective reduction planning. This accuracy forms the bedrock of your entire sustainability reporting and strategy, whether aiming for CSRD compliance or setting Science Based Targets.


.webp)
