
Free business carbon platform
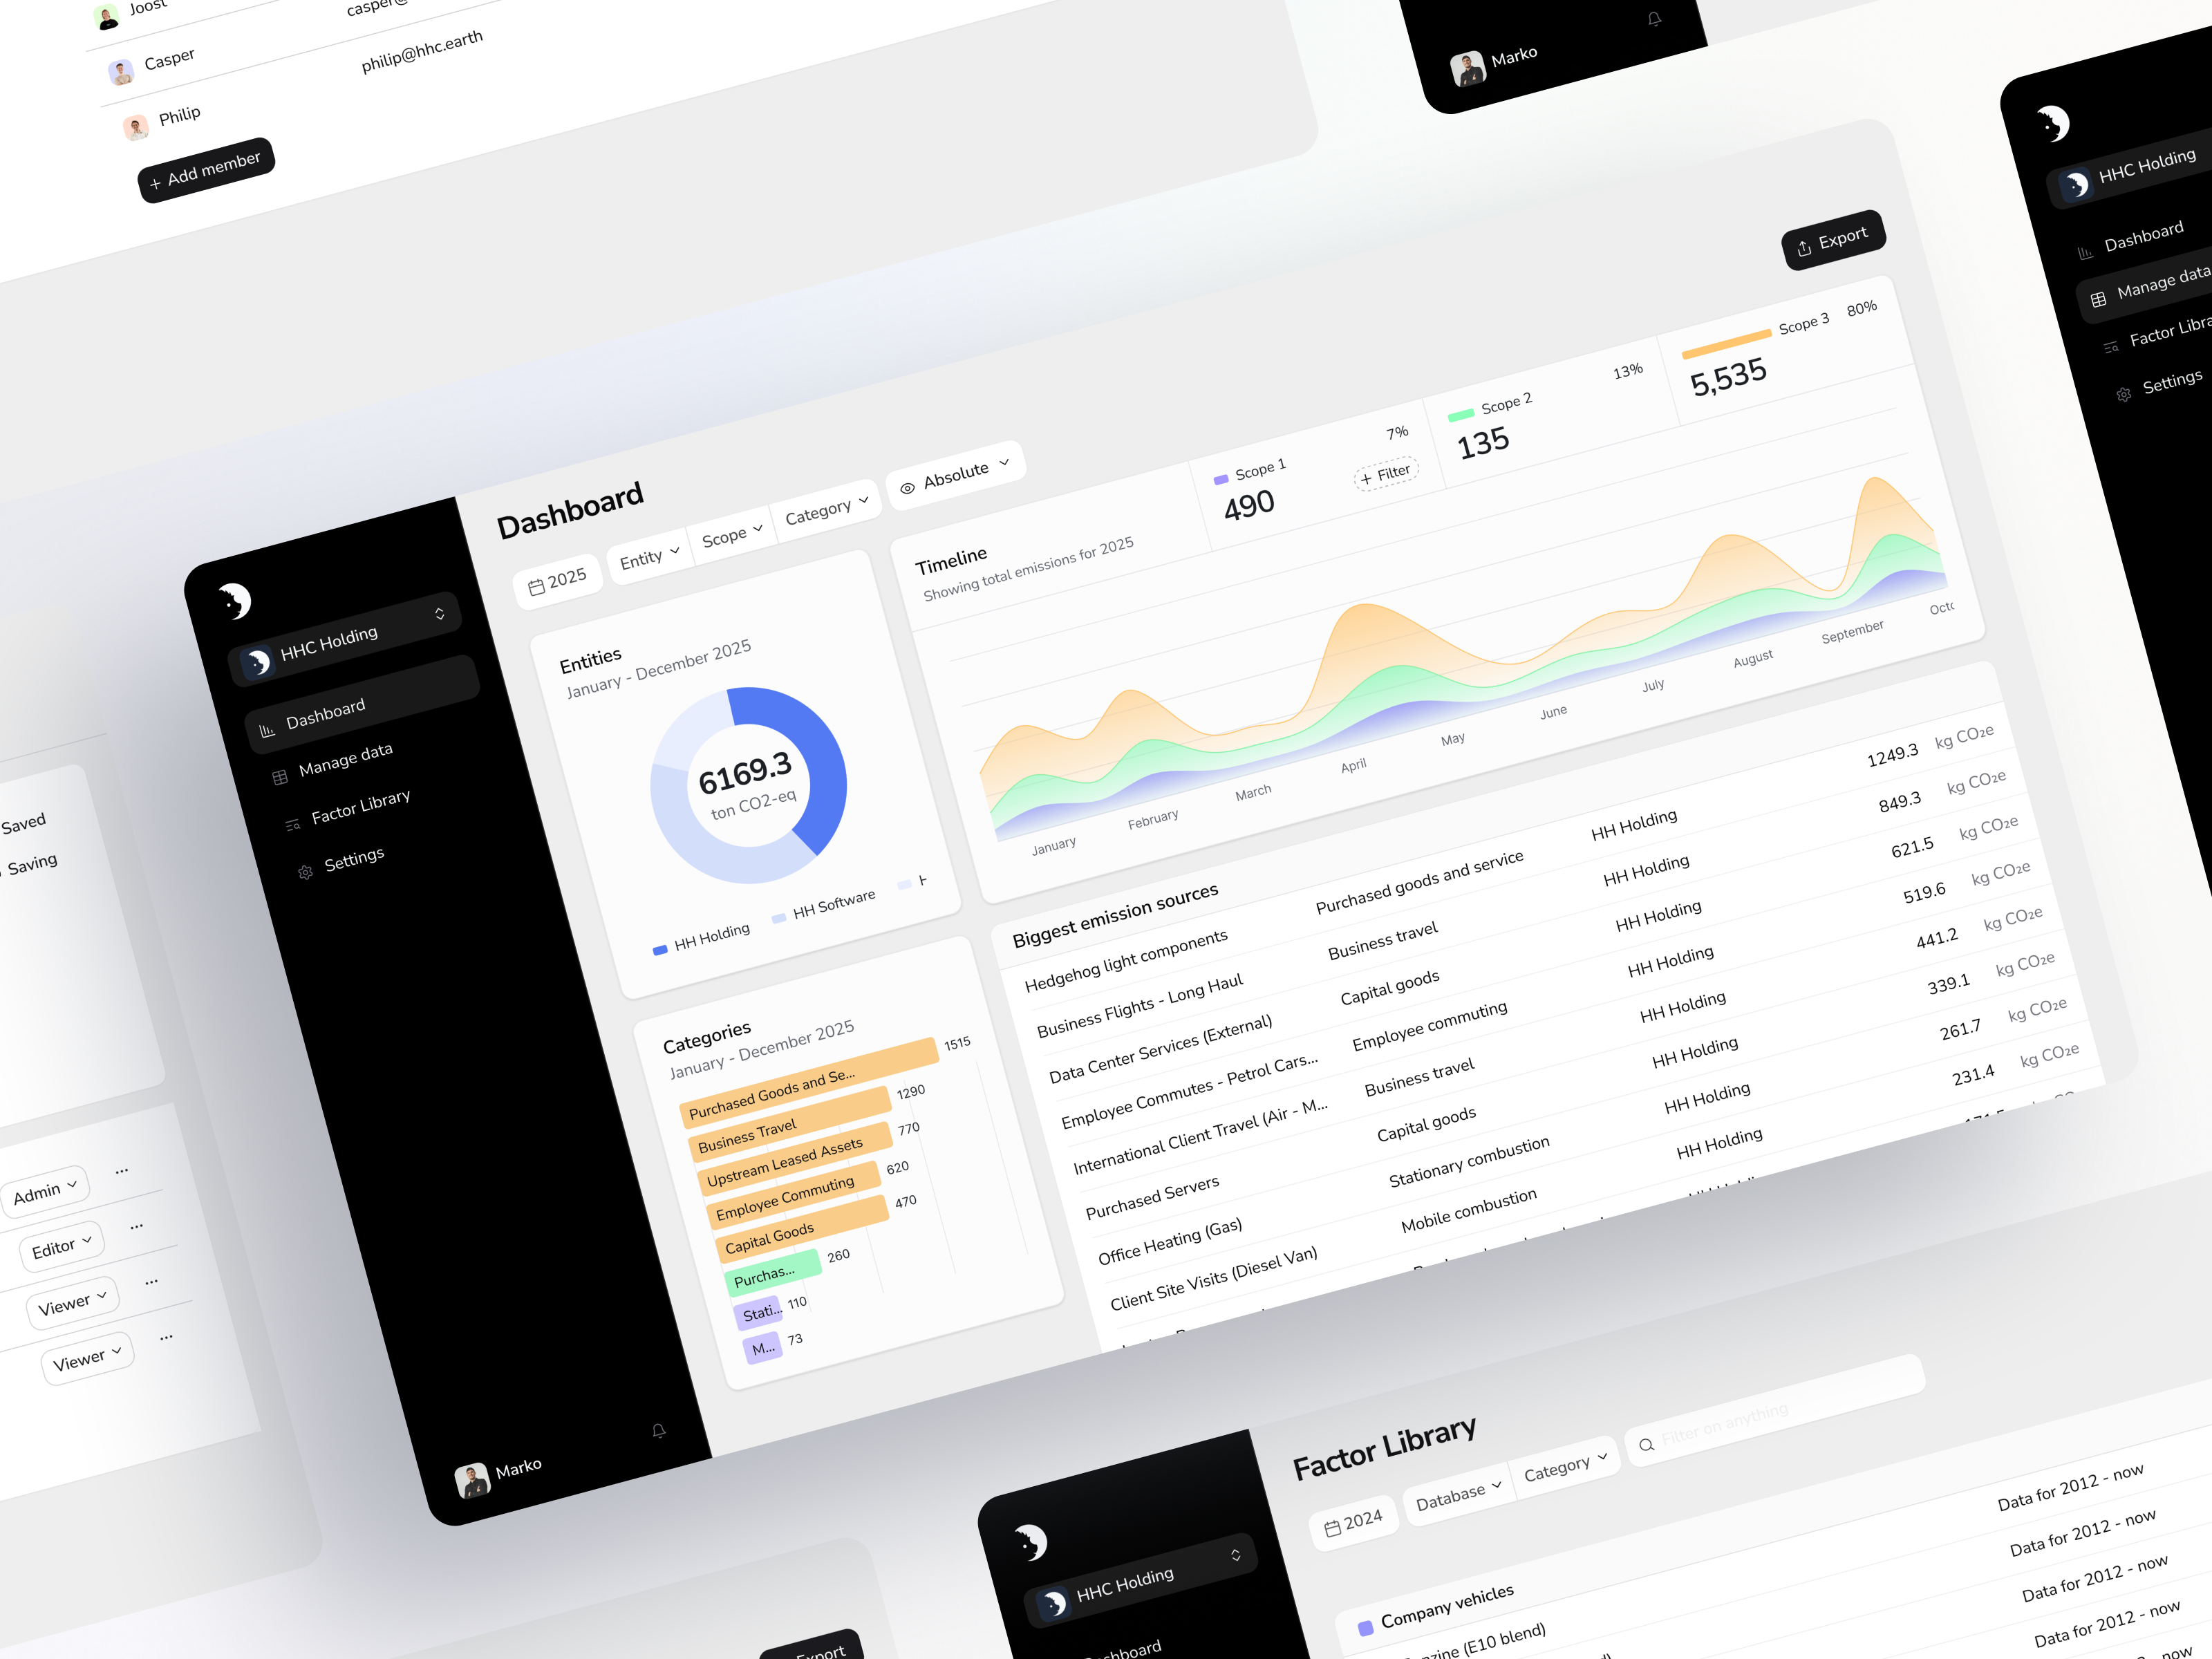
To help you get started with your businesses’ sustainable journey, we offer our free carbon footprint platform with a carbon dashboard. With this dashboard, you can monitor your greenhouse gas emissions per month or per year. The Hedgehog Carbon Platform and dashboard is compliant with the GHG-protocol.
This tool is developed for all sizes of businesses, from small and medium enterprises (SMEs) to corporates.
- The free version of the business carbon platform and dashboard includes scope 1 and scope 2 emissions, and the scope 3 emissions from business travel and employee commuting.
- In the pro version of the Hedgehog carbon platform, all emission categories from all scopes are included with company specific and tailor-made databases to gain the level of detail you need for efficient sustainable strategies.
Scroll down to start your free business carbon footprint on the Hedgehog Carbon Platform
- No demo
- Start sustainability today
- No need to remember a password, you'll receive a log-in code in your mailbox

Business carbon footprint calculator UK
The free version of our business carbon platform contains the UK database on GHG emissions. These government conversion factors for greenhouse gas reporting are for use by UK and international organisations to report on greenhouse gas emissions. These emission factor are updated on a yearly basis and are compliant with the GHG-protocol.
Why start with a free business carbon footprint?
Your business carbon footprint gives you insights in your carbon emission hotspots and allows you to perform your first carbon reduction measures on the low-hanging fruit.
Companies are an important stakeholder in the climate debate. If you don’t know where to start with sustainability, a carbon footprint is a good starting point. A carbon footprint creates an overview of your organisation’s contribution to global warming. This insight provides you with guidance for an efficient carbon reduction strategy.
Carbon footprint with the Greenhouse Gas Protocol (GHG-protocol)
The GHG-protocol is established through a partnership between the World Resources Institute (WRI) and the Business Council for Sustainable Development (WCSD). It provides a greenhouse gas accounting and reporting standard for both the public and the private sector.
The GHG-protocol structures your carbon footprint with pre-determined emissions sources. The resulting GHG inventory is divided into scope 1, scope 2 and in scope 3 carbon emissions. This allows you to structurally identify and reduce emissions of your company and its supply chain.
Scope 1, scope 2, and scope 3
The GHG-protocol classifies for direct and indirect emission sources to be considered. Scope 1 carbon emissions are direct carbon emissions. Scope 2 and scope 3 carbon emissions occur in the supply chain and are therefore indirect carbon emissions.

Scope 1 GHG emissions
Scope 1 takes all direct emissions from company assets into account. This concerns emissions released by your own building from heating, your fleet and production-related activities. Most of these emissions occur from combustion of natural gas, diesel or petrol. Some production processes release GHG gases like methane into the atmosphere, or there are cooling or AC systems that leak refrigerants.
Scope 2 GHG emissions
Scope 2 includes emissions from direct energy usage, but not emitted directly by company assets. Best example for scope 2 emissions is the generation of purchased electricity. The emissions do occur on the electricity production site. However, the energy use is direct and can be influenced by company decision-making. Other examples are direct heating or steam.
Scope 3 GHG emissions
The scope 3 inventory includes all other indirect emissions in the supply chain. Examples are the upstream emissions from the production and transportation of purchased materials, or business travel and employee commuting. Emissions that occur downstream such as from transport to users, the use phase and waste processing are also included. In total, there are fifteen scope 3 emission sources categorised in the GHG protocol. You can find an overview of these, and the scope 1 and 2 sources in.
“Box 1: Example Scope 1 en 2 emissions
Erinaceus is a marketing company with 4 employees. They have a small office and all employees use a middle-sized leased car (diesel).
Erinaceus has a standard non-renewable energy contract.
The office uses 1.500 m3 of natural gas per year for space heating.
The electricity use of the offices is 3.000 kWh per year.
Employees drive an average of 7.500 business kilometres per year.
Scope 1 emissions
Natural gas: 1,884 (kg CO2-eq per m3) * 1.500 (m3) = 2,826 ton CO2-eq
Leased cars: 0,176 (kg CO2-eq per km) * 7.500 (km) * 4 = 5,280 ton CO2-eq
Scope 2 emissions
Electricity: 0,556 (kg CO2-eq per kWh) * 3.000 (kWh) = 1,668 ton CO2-eq
Total Scope 1 en 2 emissions
9,774 ton CO2-eq emissions per year”
Scope 1 & 2 vs scope 3 in your carbon footprint
Collecting data and calculating your carbon footprint within scope 1 and scope 2 is relatively easy. We encourage organisations to monitor these scopes themselves with our free carbon platform and dashboard. Calculating scope 3 emissions might require you to hire an expert.
Moreover, you will also see that for most organisations, scope 1 and 2 are only the tip of the iceberg in their carbon footprint. Indirect emissions in the supply chain are many times higher, especially for companies downstream in the supply chain. It's a good idea to start reducing your scope 1 and 2 emissions today, since they're easier to reduce and the financial benefits can be significant. And if all organisations would tackle their scope 1 and 2 emissions, we inherently reduce all scope 3 emissions as well.

Your full business carbon footprint
GHG emissions from employee commuting and business travel are only a part of the scope 3 of your business carbon footprint. If you want to gain full insights in your organisational carbon footprint, you include the other emission factors.
The pro version of the Hedgehog Carbon Platform allows you to do just that. This dashboard is unique in its feature to include activity based information on your supply chain, to be consolidated with your emissions from scope 1 and scope 2 in your carbon footprint. Activity-based impact information are high quality insights from products carbon footprint or life cycle assessments.
With this unique feature, you gain insights in your full business carbon footprint to a level of detail not existent before.


