
In short
- Excel is a perfectly good calculator and a poor system of record for an annual, audited number.
- The break points are factor versions, consolidation across entities, and being able to show your working.
- Moving to a platform does not remove the data work. It removes the rebuild.
A spreadsheet is a fine way to produce your first carbon footprint and a poor way to produce your fourth. It calculates correctly, costs nothing and everyone can already use it. It has no memory of which emission factor version produced last year's number, no safe way to consolidate five entities, and no route from a published figure back to the source record. If you report once, use Excel. If you report annually, to a customer or an auditor, the spreadsheet is the thing that eventually fails, and it fails at the worst moment.
This is a comparison of two tools. It is not about who does the work, which is a separate decision with a separate answer.
What does a spreadsheet actually do well?
More than platform vendors like to admit, so let us be specific.
It calculates. Activity data times an emission factor is arithmetic. A spreadsheet does arithmetic perfectly.
It is infinitely flexible. When your boundary is odd, when a site reports in a unit nobody else uses, when you need a one-off adjustment for a divested business, a spreadsheet just does it. Software argues with you.
It has no procurement cycle. You can start this afternoon.
Everyone can read it. A finance director can open the file and follow the logic without a login or a demo. That transparency is genuinely valuable and it is the thing platforms most often lose.
For a single-entity company doing scope 1 and 2 for the first time, a spreadsheet is not a compromise. It is the correct tool, and anyone telling you otherwise is selling something.
Where does the spreadsheet actually break?
At five specific points, all of which arrive in year two or three rather than year one.
| What you need | In a spreadsheet | In a platform |
|---|---|---|
| Know which factor version produced a number | You remember, or you do not | Recorded against the entry |
| Consolidate several entities without double counting | Manual, and the error is silent | Entity structure with roles |
| Restate a prior year but keep the original | Save As, then hope | Versioned, with the original intact |
| Show an auditor the route from invoice to figure | Rebuild the trail by hand | Export the trail |
| Hand the same numbers to five customer templates | Five files that drift apart | One dataset, several exports |
The common thread is not calculation. It is memory. A spreadsheet holds a result. An annual, audited carbon number needs a system that holds how the result was produced, which is a different requirement and the one Excel was never built for.
Factor versions are the sharpest edge. Emission factors update. When yours do, you need to know whether this year's reduction is a real reduction or a factor revision. A spreadsheet that hardcodes factors into a column cannot answer that question a year later, and neither can the person who built it.
Consolidation errors are silent. A missing site or a double-counted intercompany transaction does not throw an error. It just produces a number that is wrong in a direction nobody notices until an auditor does.
Does moving to a platform remove the data work?
No, and any vendor implying otherwise is worth distrusting.
The hard part of carbon accounting is not the sum. It is getting energy bills, fuel cards, purchase ledger lines and supplier responses into a consistent shape. That work exists in both tools, in roughly the same volume, the first time you do it.
One of our own customers put it plainly on G2 in August 2026, a Small-Business reviewer who said that once the data is loaded everything works perfectly, and that getting it loaded is the challenging part. That is the honest shape of a first year in any platform, including ours.
What a platform removes is the rebuild. In a spreadsheet, year two starts by opening last year's file and trying to remember what the tabs meant. In a platform, year two starts with a structure that already exists and a list of what changed. The saving is in year two and compounds after that, which is exactly why the business case looks weak if you only price year one.
What can neither tool do for you?
Product footprints.
If a customer asks for the emissions of one product rather than of your company, you are in a different discipline. An LCA, an EPD, an ECI (MKI in Dutch) or a product carbon footprint needs a defined functional unit, a modelled system boundary and, usually, a reviewer. Neither a spreadsheet nor an organisational carbon platform produces that as a feature. At Hedgehog that work sits with LCA consulting as a service, while the platform handles organisational footprints.
Being clear about which of the two you have been asked for saves more time than any tool choice on this page.
Which should you actually use?
Decide on frequency, entities and audience, in that order.
Stay in Excel if you have one legal entity, you are calculating scope 1 and 2, nobody is auditing it, and the report is for internal use or a single questionnaire. Add a tab that records the factor source and version for every line, and date it. That one habit fixes most of what goes wrong later.
Move to a platform when any two of these are true: you report every year, you have more than one entity or site, an auditor or a certification scheme reviews the figure, several people enter data, or customers ask for the same numbers in different formats. Two of five is the practical threshold. One of five is usually still a spreadsheet.
Move immediately if you are being audited and cannot currently show the route from a source document to a reported figure. That is not a maturity question, it is a finding waiting to happen.
How do you cross over without losing the history?
Four steps, and the order matters.
Recreate one closed year, not the current one. Load a year you have already reported and check the platform reproduces your number. If it does not, you learn why before anything is at stake.
Keep the spreadsheet as an archive, not a parallel system. Running both for a year is how teams end up with two different numbers and no way to say which is right.
Carry the factor decisions across explicitly. Every place where you chose a factor, write down why. That is the part of the spreadsheet that lives in someone's head, and it is the part that does not migrate on its own.
Load your simplest data first. Energy and fuel before the purchase ledger. You get a real number quickly and you learn how the tool behaves before you hit the hard data.
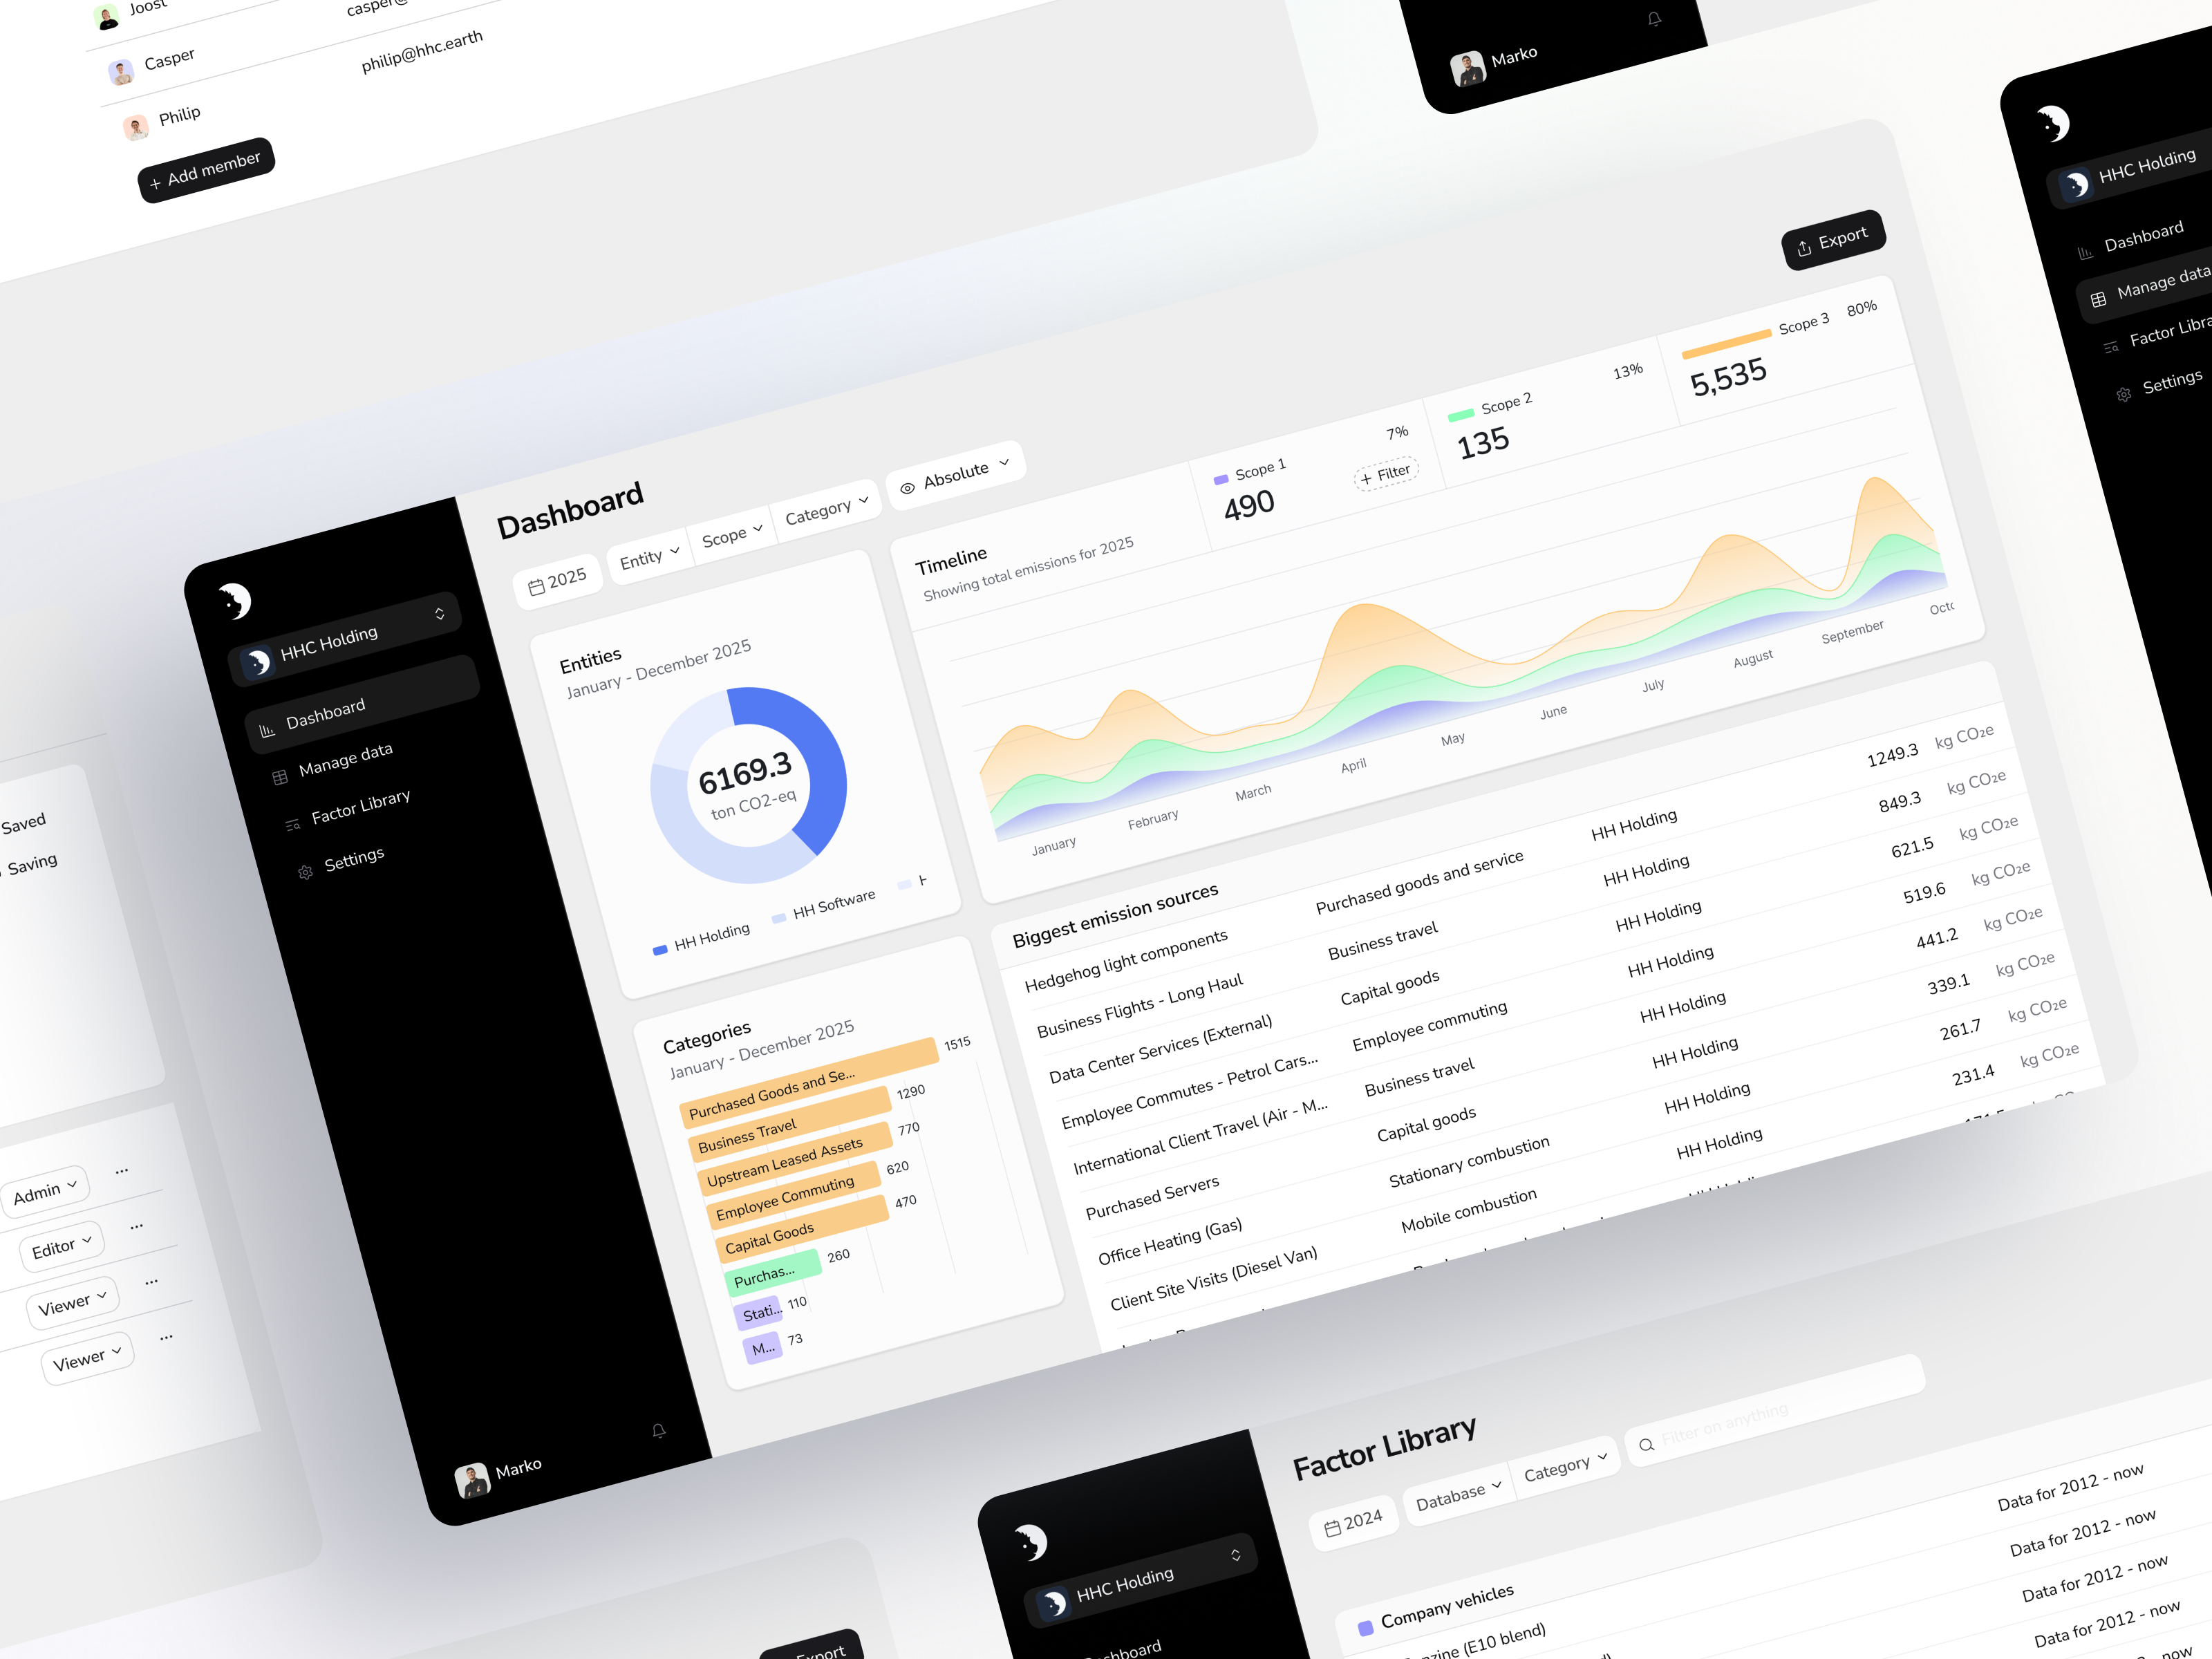
On our side, the platform guides GHG Protocol setup, inventory building and data upload with an AI assistant, holds over 20,000 spend-based and activity-based factors, lets you add organisation-specific or supplier-specific data, and manages multiple entities with roles for data owners, auditors and managers. Free account, no sales call, and Pro from EUR 1,200 a year.
One limit to know before you migrate: applied conversion factors and distance calculations are not exposed to the user today. A Mid-Market customer raised this on G2 in July 2026, asking to see the conversion factor applied when their input in USD became an entry in EUR. If your spreadsheet's main virtue is that you can see every step, that is a real trade you are making.
What should you do this week?
Open your current spreadsheet and try to answer one question: which emission factor, from which database and which version, produced the largest single line in it? If you can answer in under a minute, you are fine for another year. If you cannot, that is the thing to fix, whichever tool you use next.
If you want to test the comparison rather than argue about it, start a free account and reload a year you have already reported. Our guide to choosing carbon accounting software covers what else to test, and carbon accounting from scratch is the better starting point if you have not built a first inventory at all yet.
Sources: the Hedgehog platform page and the Hedgehog G2 profile, both read on 27 August 2026. No competitor is named on this page because the comparison is with a spreadsheet. Verified 16 September 2026.
Facts on this page were last verified on 2026-09-16.

