
In short
- The pressure comes from your processor and your cooperative, not from a regulator.
- Methane and nitrous oxide dominate. A CO2-only figure understates a farm badly.
- Your herd, crop, feed and fertiliser records are the dataset. They already exist.
On a farm the request usually comes from a food processor rather than a regulator. Processors need farm-level data for their own scope 3 reporting, so the number travels up the chain with your milk, meat or crop. The number they need is not a CO2 figure. Methane from livestock and nitrous oxide from soils and fertiliser dominate an agricultural footprint, and land use sits alongside them, so a carbon tool that only counts fuel and electricity will understate a farm badly. What you need is a repeatable CO2e inventory built from records you already keep.
Which rule actually applies to a farm business, and when?
The practical trigger is commercial. Food processors request farm-level data so they can complete their own scope 3 inventories, and that request lands through your buyer, your cooperative or your contract renewal rather than through an inspection.
That has three consequences worth planning around.
The deadline is your contract cycle, not a reporting year. Requests tend to arrive with supply agreements and renewals, which means the notice period is short and the format is whatever the processor uses.
The format is not yours to choose. Different processors ask different questions in different spreadsheets. The value of doing this properly once is that you can answer all of them from the same underlying figures.
You are entitled to push back on scope. A large buyer collecting value chain data cannot reasonably demand unlimited bespoke information from a small supplier. We cover where that line sits in refusing ESG questions you do not have to answer, which applies to farm businesses as much as to any other supplier.
Where do agricultural emissions actually sit?
Not where a generic carbon tool looks first.
Methane. Enteric fermentation from ruminants and manure management. On a livestock farm this is typically the single largest source, and it is invisible to any tool that starts from energy bills.
Nitrous oxide. Soils and fertiliser application. It is the second story on most arable and mixed farms.
Land use. Part of the picture in agriculture in a way it is not in most other sectors.
Fuel and electricity. Real, measurable, and a much smaller share of the total than the effort spent measuring it would suggest.
The practical upshot: a farm footprint built only from diesel and power will produce a number that is precise, defensible and far too small. Anyone reviewing it who knows agriculture will spot that in a minute.
Why is a CO2-only number the wrong answer here?
Because the gases that matter on a farm are not carbon dioxide, and they do not behave like it.
An agricultural inventory has to be expressed in CO2 equivalent, with methane and nitrous oxide converted using published global warming potentials, and it has to say which conversion basis it used. A processor comparing farms needs that stated, because two farms using different bases are not comparable.
This is also why the phrase "carbon footprint" causes trouble in agriculture. What is being asked for is a greenhouse gas inventory in CO2e. If a tool or a template only offers you a CO2 field, it was not built for this sector and you should say so rather than fitting your farm into it.
Where does the data actually come from?
From records you already keep for other reasons, which is the good news.
- Source: Herd records
What it gives you: Animal numbers and categories, the basis for enteric methane
How hard it is: Already maintained, needs structuring by period - Source: Crop and land records
What it gives you: Areas, yields, cropping plan
How hard it is: Already maintained - Source: Feed purchases
What it gives you: Purchased feed volumes and types, an upstream line
How hard it is: Invoices exist, categorisation is the work - Source: Fertiliser use
What it gives you: Application rates and product types, the nitrous oxide driver
How hard it is: Usually recorded, sometimes only on paper - Source: Fuel and energy
What it gives you: Diesel, gas and electricity
How hard it is: Easiest, and the smallest share
Nothing on that list requires new instrumentation. It requires the records to be pulled into one place for one defined period and categorised consistently, which is a data admin job rather than a measurement job.
What does the software actually have to produce?
Five things, in the order a processor request will test them.
A CO2e figure with the gases separated. Methane, nitrous oxide and CO2 shown individually as well as combined. A single blended number is not enough for a processor doing its own scope 3 work.
A stated period and boundary. Which enterprises, which land, which year.
A repeatable method. Next year's figure has to be comparable to this year's, otherwise a reduction cannot be shown and the exercise has no commercial value.
An export that survives someone else's template. You will be asked for the same numbers in several formats. Test this with a real processor spreadsheet before you commit to a tool.
A route back to the source record. When a buyer queries a line, you need to show where it came from.
What does Hedgehog do for farm businesses, and what does it not?
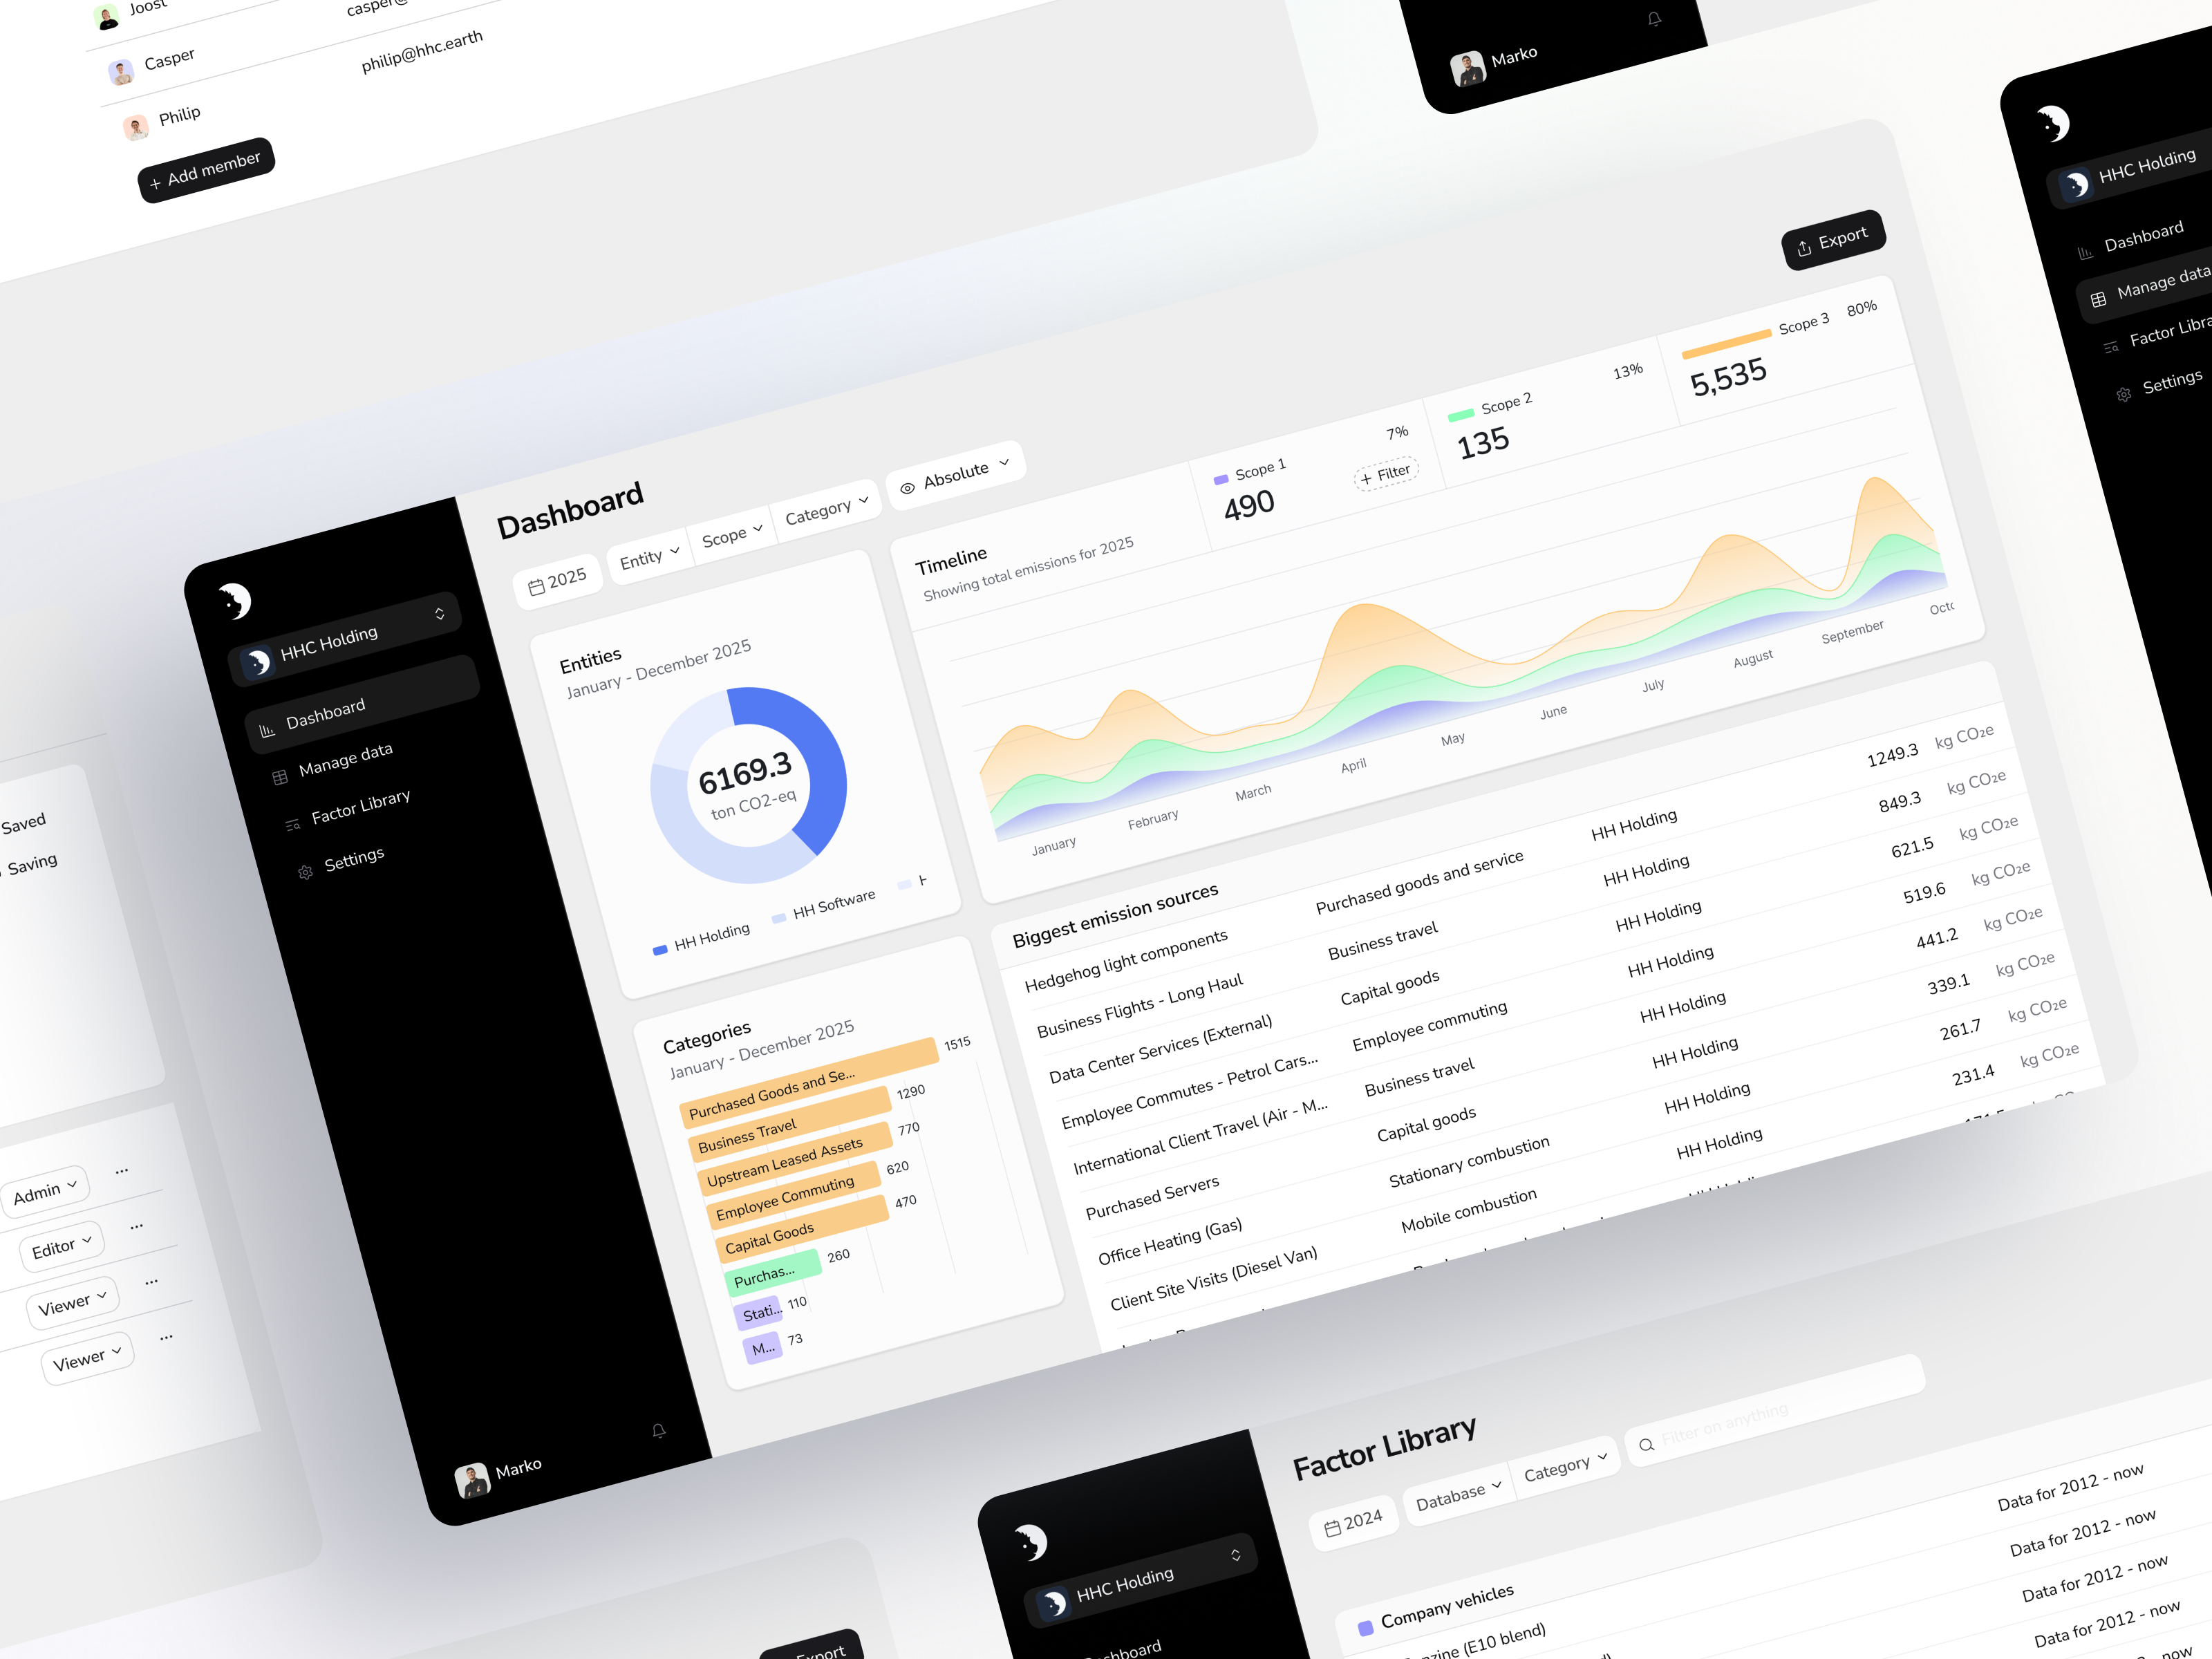
The platform guides you through GHG Protocol setup, building a data collection plan and a GHG inventory, with an AI assistant for setup and human GHG experts reachable in-app. It carries over 20,000 spend-based and activity-based emission factors and lets you add organisation-specific or supplier-specific data, which is the mechanism for bringing in figures your cooperative or feed supplier gives you. Multi-entity management covers farms run as several businesses. You can open a free account without a sales call, and Pro starts at EUR 1,200 a year.
Two limits to weigh honestly before you start.
Loading the data is the work. A Small-Business reviewer put it this way on G2 in August 2026: the platform works perfectly once the data is loaded, and getting it loaded is the challenging part. On a farm, where records sit across a herd system, a spray diary, a fuel account and a shoebox of invoices, that is the honest shape of a first inventory. It is a few weeks of admin, not an afternoon.
Product footprints are a service, not a feature. If your processor asks for the footprint of a litre of milk or a tonne of a specific crop rather than of the farm business, that is product-level work with a defined functional unit. At Hedgehog that is delivered through carbon footprint consulting and LCA consulting. The platform produces the organisational footprint. Both are useful, and you should know which one has been asked for before you buy either.
What should you do first?
Read the request you were sent and work out whether it asks about the business or about a product. That single distinction decides everything that follows, and it is the question most farm businesses skip.
Then pick one complete year and pull five things into one folder: herd or crop records, feed invoices, fertiliser records, fuel accounts and electricity bills. That folder is your inventory. Everything after it is categorisation and arithmetic.
If you have never built a greenhouse gas inventory before, carbon accounting from scratch is the right starting point. When you are ready to see a first number, you can start a free account without talking to anyone.
Sources: the Hedgehog platform page and our G2 profile, read on 27 August 2026. Agricultural sector facts come from the Hedgehog industry fact base, verified 27 August 2026. Global warming potential values should be taken from the published set your processor specifies.
Facts on this page were last verified on 2026-08-27.

