
In short
- Library size is the easiest thing to advertise and the least useful to compare.
- Traceability beats coverage: you need to see which factor produced which figure.
- Match the source to the question, not to the marketing claim.
An emission factor database is the lookup table that turns your activity data into emissions: so many kilograms of CO2 equivalent per litre of diesel, per kilowatt hour, per tonne kilometre or per euro spent. Anyone building a greenhouse gas inventory uses one, whether or not they realise it, because no company measures its own emissions directly. What you should do next is stop comparing library sizes and ask three things of any tool: where the factors come from, how often they are updated, and whether you can see which factor was applied to which line of your data. That last question decides whether your figure survives scrutiny.
Factor databases are the least glamorous part of carbon accounting and the part most likely to cause an argument with an auditor. Here is a practical way to think about them.
What kinds of factor source actually exist?
Four categories, and they answer different questions. Most inventories use several at once, which is normal and correct.
| Category | What it gives you | Best for | Main weakness |
|---|---|---|---|
| National government factor sets | Fuels, electricity, transport, waste for one country | Scope 1 and 2, national reporting | Country-specific, thin on purchased goods |
| Environmentally extended input-output data | Emissions per unit of economic spend by sector | Fast scope 3 screening | Sector averages, insensitive to supplier choice |
| Life cycle inventory databases | Emissions per physical unit of a material or process | Product studies, material choices | Detailed, expensive, needs expertise |
| Supplier-specific and primary data | Emissions from your actual supplier or site | Hotspots you intend to act on | You have to obtain it, one supplier at a time |
A few names are worth knowing because you will meet them in method notes. The UK government publishes a conversion factor set annually that is the default for UK reporting. The IPCC maintains an emission factor database used as a reference for national inventory work. EXIOBASE is a widely used environmentally extended input-output dataset. Ecoinvent is a widely used life cycle inventory database. Which of these a platform draws on, and under what terms, is a question for the vendor rather than something to assume.
Why do two platforms give different answers for the same activity?
Because a factor is a modelling choice, not a physical constant. Six things move the number.
The country. A kilowatt hour in France and a kilowatt hour in Poland are not close. Grid factors also change year to year as generation mixes shift.
The vintage. Factor sets are revised, usually annually. A 2025 factor and a 2026 factor for the same activity are different numbers, and comparing years across a factor update without saying so is one of the more common quiet errors.
Market-based or location-based electricity. Two legitimate methods, two very different answers where renewable contracts exist. Both should usually be reported.
Gases included. Some factors cover carbon dioxide only, some cover all Kyoto gases as CO2 equivalent, and some include well-to-tank as well as tank-to-wheel energy. Mixing these silently is a real source of error.
The global warming potential set used. Different IPCC assessment reports give slightly different values for methane and other gases.
Spend-based versus activity-based. The largest divergence of all, which deserves its own section.
None of that means one platform is wrong. It means a number without a stated method is not comparable to anything.
Spend-based or activity-based: which do you need?
Both, at different times, and the transition between them is the story of most maturing inventories.
Spend-based multiplies what you paid by a sector average. It is fast, it covers everything in your ledger, and it is insensitive to how good your supplier actually is. Switching to a cleaner supplier at the same price does not move your number.
Activity-based multiplies a physical quantity by a factor for that thing. Litres, kilometres, kilowatt hours, tonnes. It is more work and it responds to real change.
The practical route is to screen everything spend-based, find the categories carrying the mass, then move those categories to activity-based data and leave the tail alone. Doing this well across a supply chain is genuinely difficult, which is why scope 3 work is often where companies bring in help.
One warning about the switch: recalculate the earlier year on the new method, or your year on year comparison shows a reduction you did not achieve.
Does the size of a factor library matter?
Much less than the marketing implies.
Library size is easy to advertise and hard to interpret. A library counting every regional variant of every material across twenty countries produces an enormous number that tells you nothing about whether it covers the forty activities your business actually performs.
Three questions are more informative than any count.
Does it cover my categories, in my countries, at the granularity I have data for? Can I add my own supplier-specific factor when I obtain one? And can I see which factor was applied to a given line?
A library of moderate size that covers your activities and lets you substitute primary data will outperform a huge one that does not.
What should you ask a vendor about their factors?
Five questions. Ask them in writing before you buy anything.
- Which factor sources do you use, for which categories and which countries?
- How often are they updated, and what happens to my historical periods when they are?
- Is each figure traceable to the specific factor and version that produced it?
- Can I add my own organisation-specific or supplier-specific factors?
- Do you support market-based and location-based electricity reporting side by side?
The third question is the one that separates tools. It is also the one auditors care about most, because assurance is a test of traceability rather than a test of arithmetic. The wider selection criteria are covered in our guide to choosing carbon accounting software.
Where does Hedgehog sit, and what should you know?
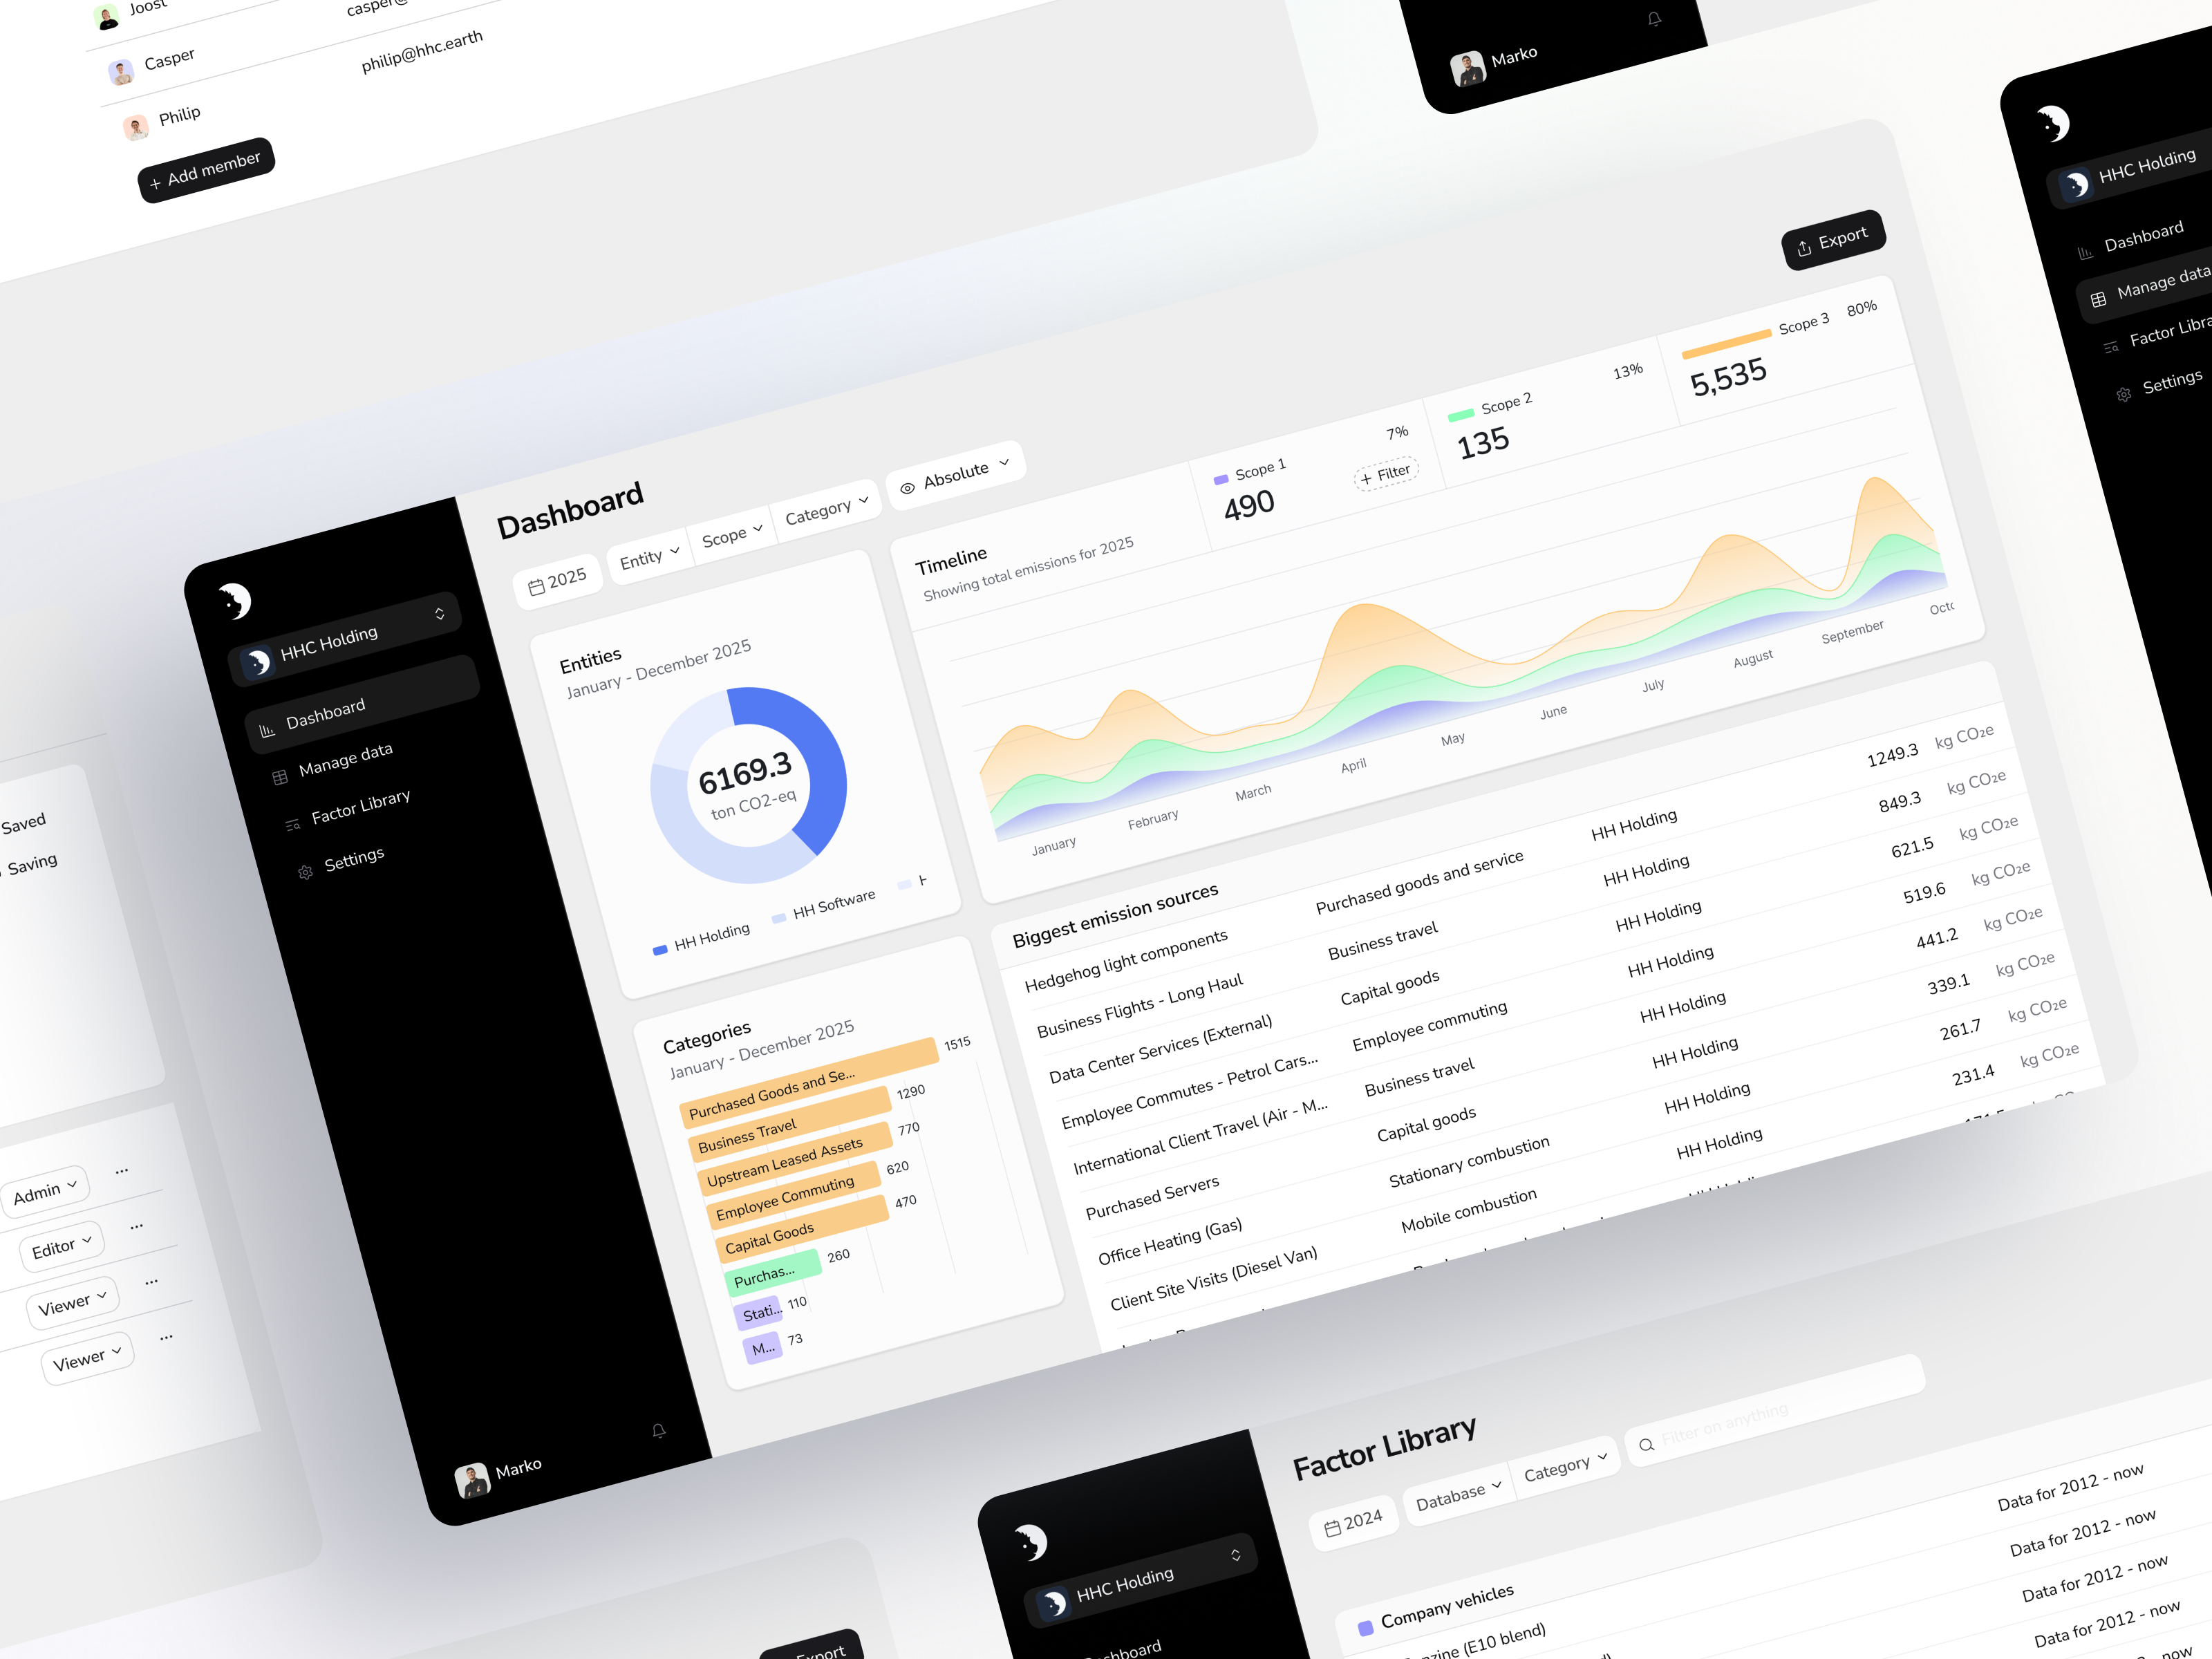
The platform carries more than 20,000 spend-based and activity-based data factors, and customers can add their own organisation-specific or supplier-specific CO2 data, which is the mechanism for moving a material category off sector averages onto something real.
Two limits stated plainly, both from paying customers on our public G2 profile.
Factor traceability is not fully exposed yet. A customer rated us 4 out of 5 on G2 in July 2026 and asked to see the conversion factor applied when an input in one currency became an entry in another, and to see which calculator produced a distance in a distribution overview. A customer in June 2026 said they could not easily navigate to the exact number or database behind a chosen factor, only its name, and noted we are fixing that. Given that this page argues traceability is the thing that matters most, it would be dishonest not to say that it is the thing we are still improving. Ask us where it stands before you rely on it for assurance.
Loading the data is the slow part. A customer said on G2 in August 2026 that it takes a lot of manual labour to load data, and that once it is in, everything works perfectly. Factor quality only starts to matter once the activity data is there.
One boundary worth being clear about: the platform builds organisational footprints. Product-level work, LCA, EPD, MKI and PCF, is delivered as a service, because a product study needs a defined functional unit, process-level data and often a reviewer, which is a project rather than a lookup.
What should you do next?
Pick your three largest emissions categories and ask, for each one, whether you are using a sector average or something specific to you. Those three answers describe the real quality of your inventory far better than any database name.
Then test it. Open a free account, enter one month of a real category, and check whether you can trace the output back to the input. If you can, you have a figure you can defend. Our beginner's guide to building a footprint covers what to collect first.
Sources: Hedgehog platform, Hedgehog on G2. Verified 27 August 2026, re-checked against the verbatim reviews 17 September 2026.
Facts on this page were last verified on 2026-09-17.

