
In short
- Waiting for clean data is the most expensive way to delay a footprint.
- Estimate the small categories, document the estimate, and improve them next year.
- The first load is the hard one. Design it so the second load is a refresh.
Messy data means what everyone actually has: invoices as PDFs, meter readings in three formats, a fleet list nobody has updated, travel bookings without distances, and a general ledger where half of scope 3 is hiding under office supplies. Every company building a first greenhouse gas inventory has this, including the ones with tidy finance functions. What you do next is not clean it. It is load the good data first, estimate the rest with a documented method, and mark every estimate so you know what to improve next year. An inventory with labelled gaps is usable. A perfect inventory that arrives two years late is not.
The single most common reason a carbon programme stalls is waiting for data quality that was never going to arrive on its own. Here is a way through it.
What does messy actually look like?
Five shapes, and it helps to name which ones you have before you start.
Wrong format. The data exists but as a PDF, an image or a portal you cannot export from. Solvable with effort, not with judgement.
Wrong granularity. You have one annual invoice covering four sites, or one fuel card total covering vans and cars. Needs an allocation rule.
Wrong unit. Currency instead of litres, spend instead of tonnes, a supplier total instead of a delivery. Needs a conversion, and the conversion needs to be recorded.
Missing period. Nine months of readings and a gap where a meter was replaced. Needs an interpolation you can defend.
Missing entirely. Nobody ever recorded homeworking energy, waste tonnage or upstream transport. Needs an estimate or an exclusion, stated openly.
Only the last two involve real judgement. The first three are work, and work is schedulable.
Who actually has this problem?
Almost everyone in their first cycle, and some organisations structurally.
Companies with multiple sites, where each site keeps records its own way. Companies that grew by acquisition, where two finance systems have never been reconciled. Asset-light service businesses, where nearly all the footprint sits in purchased goods and services and the only evidence is a ledger. Businesses with leased vehicles, subcontracted logistics or shared premises, where the data belongs to somebody else entirely.
If you are in one of those groups, plan for data work to be the bulk of the effort. If you are a single site company with your own utility contracts, you are in a much better position than you think.
In what order should you load it?
Easiest and largest first, always. Momentum matters more than completeness at this stage.
One: metered energy. Electricity, gas, district heat. Usually monthly, usually already in kilowatt hours, usually available from a supplier portal. This is your scope 2 and it builds confidence.
Two: fuel. Fuel cards, delivery notes, on-site tanks. Convert to litres where you can, spend where you cannot, and note which you used.
Three: the ledger. Export a full year of spend by account code and map codes to categories. This gives you a spend-based screening of scope 3 in a day and tells you where the mass is.
Four: the categories the ledger flagged. Only now go looking for better data, and only for the categories that turned out to matter.
Five: everything else, estimated. Waste, water, homeworking, small travel. Estimate, document, move on.
That order gets a defensible whole-inventory number out in weeks. The alternative order, perfecting category one before starting category two, is how first footprints take a year.
How good does the data have to be?
Good enough for the decision it supports, and no better. Different tiers are appropriate for different categories.
| Data tier | What it is | Use it for |
|---|---|---|
| Primary measured | Your own meters, your own weighbridge | Large scope 1 and 2 categories |
| Supplier reported | A figure your supplier gives you | Material suppliers you engage with |
| Activity based | Physical quantity times a published factor | Anything with a countable quantity |
| Spend based | Money times a sector average | Screening and the long tail |
| Documented estimate | A stated assumption with a stated basis | Small categories, first year gaps |
Nobody should be spending three weeks improving a category that is one percent of the total. Rank your categories by size before you rank them by data quality, and spend the effort where it moves the number.
What do you do with a gap you cannot close?
Estimate it and write down four things: what you assumed, what you based it on, what period it covers, and what you would need to replace it.
That last field is the one people skip and it is the most valuable. A gap log that says "homeworking estimated from headcount and a published average, replace with a staff survey in FY27" is a work plan. A footnote saying "estimated" is not.
Exclusions work the same way. Excluding a category is legitimate if it is immaterial and disclosed. Excluding it silently is not, and it is the kind of thing that surfaces during assurance or when a customer compares your two reports.
What should a platform actually do about mess?
Four things, and it is worth testing each before you commit.
Accept the shapes you have. Spreadsheet upload with flexible column mapping matters more than any dashboard feature in year one.
Let you enter at any granularity. Annual, quarterly, monthly, per site, per entity. If a tool demands monthly data you do not have, you will fake it, which is worse than entering an annual figure honestly.
Hold a spend-based route and an activity-based route side by side. So you can screen fast and refine later without rebuilding.
Keep the mess visible. Flag estimated lines, keep the assumption attached to the figure, and let you re-open a category next year without disturbing the rest.
A platform that only accepts clean data is a platform for your third year, not your first.
Where does Hedgehog sit, and what is the honest picture?
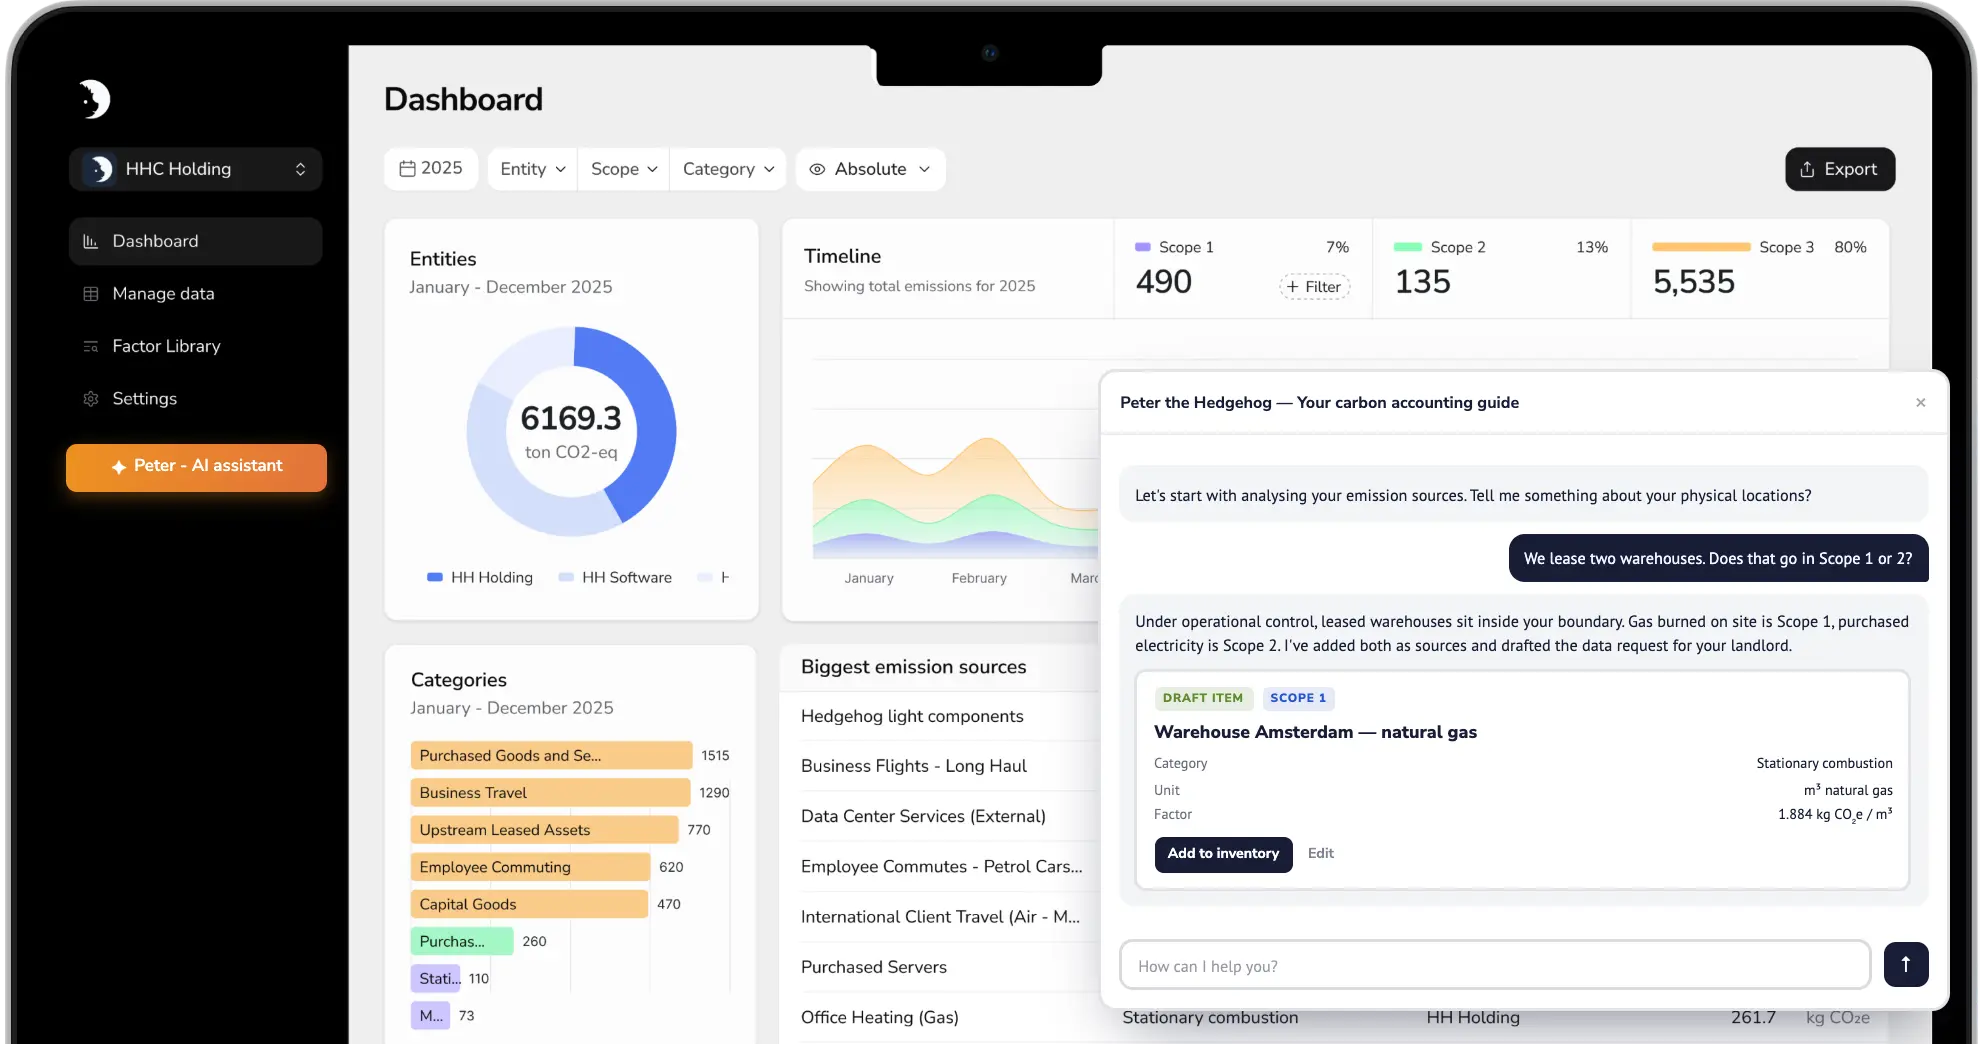
The platform is designed for this stage: an AI assistant guides GHG protocol setup, inventory building, data upload and reporting, and the factor library carries more than 20,000 spend-based and activity-based factors, so you can screen a category on spend and move it to activity data later. You can add your own organisation-specific or supplier-specific CO2 data as it arrives, and entity management with roles for data owners, auditors and managers lets each site owner load their own records rather than emailing them to one person. The free account needs no sales call, and paid plans begin at EUR 1,200 a year.
Two things we will not dress up.
Loading data is manual work. A customer said on G2 in August 2026 that it requires a lot of manual labour to load data, and that once the data is there it works perfectly, but getting it loaded is the challenging part. That is the fairest single sentence anyone has written about this stage of the process, in our product or any other.
Integrations are thin. On G2 in June 2026, a Mid-Market customer answered the question about what they disliked with a single request: more integrations in the future with other software. If you were expecting your accounting system to feed the platform automatically, check where that stands before you assume it.
One boundary: this is organisational footprint work. If your mess is product-level, bills of materials, process data and functional units, that is LCA territory and we deliver it as a service rather than as a feature.
What should you do next?
Pick your single messiest category and load one month of it. Not a year, one month. You will learn more about your real data position in that hour than in any amount of planning, and the estimate you build from it is what makes the rest of the schedule honest.
Then work down the order above. Our beginner's guide to building a footprint from scratch covers the collection sequence, and if you are still choosing a tool, our guide to choosing carbon accounting software lists what to test for.
Sources: Hedgehog platform, Hedgehog on G2. Verified 27 August 2026.
Facts on this page were last verified on 2026-09-17.

