Do you find scope 3 emission reporting a burden? In this article we cut through the complexity, showing EU SMEs exactly how to identify and tackle their biggest carbon hotspots.
You've likely tackled your direct emissions, covering scope 1 and 2 from your facilities and vehicles. But for most businesses, often more than 80% of of their carbon footprint lies hidden throughout the entire value chain: these are your scope 3 emissions. Understanding them is key to meaningful climate action.
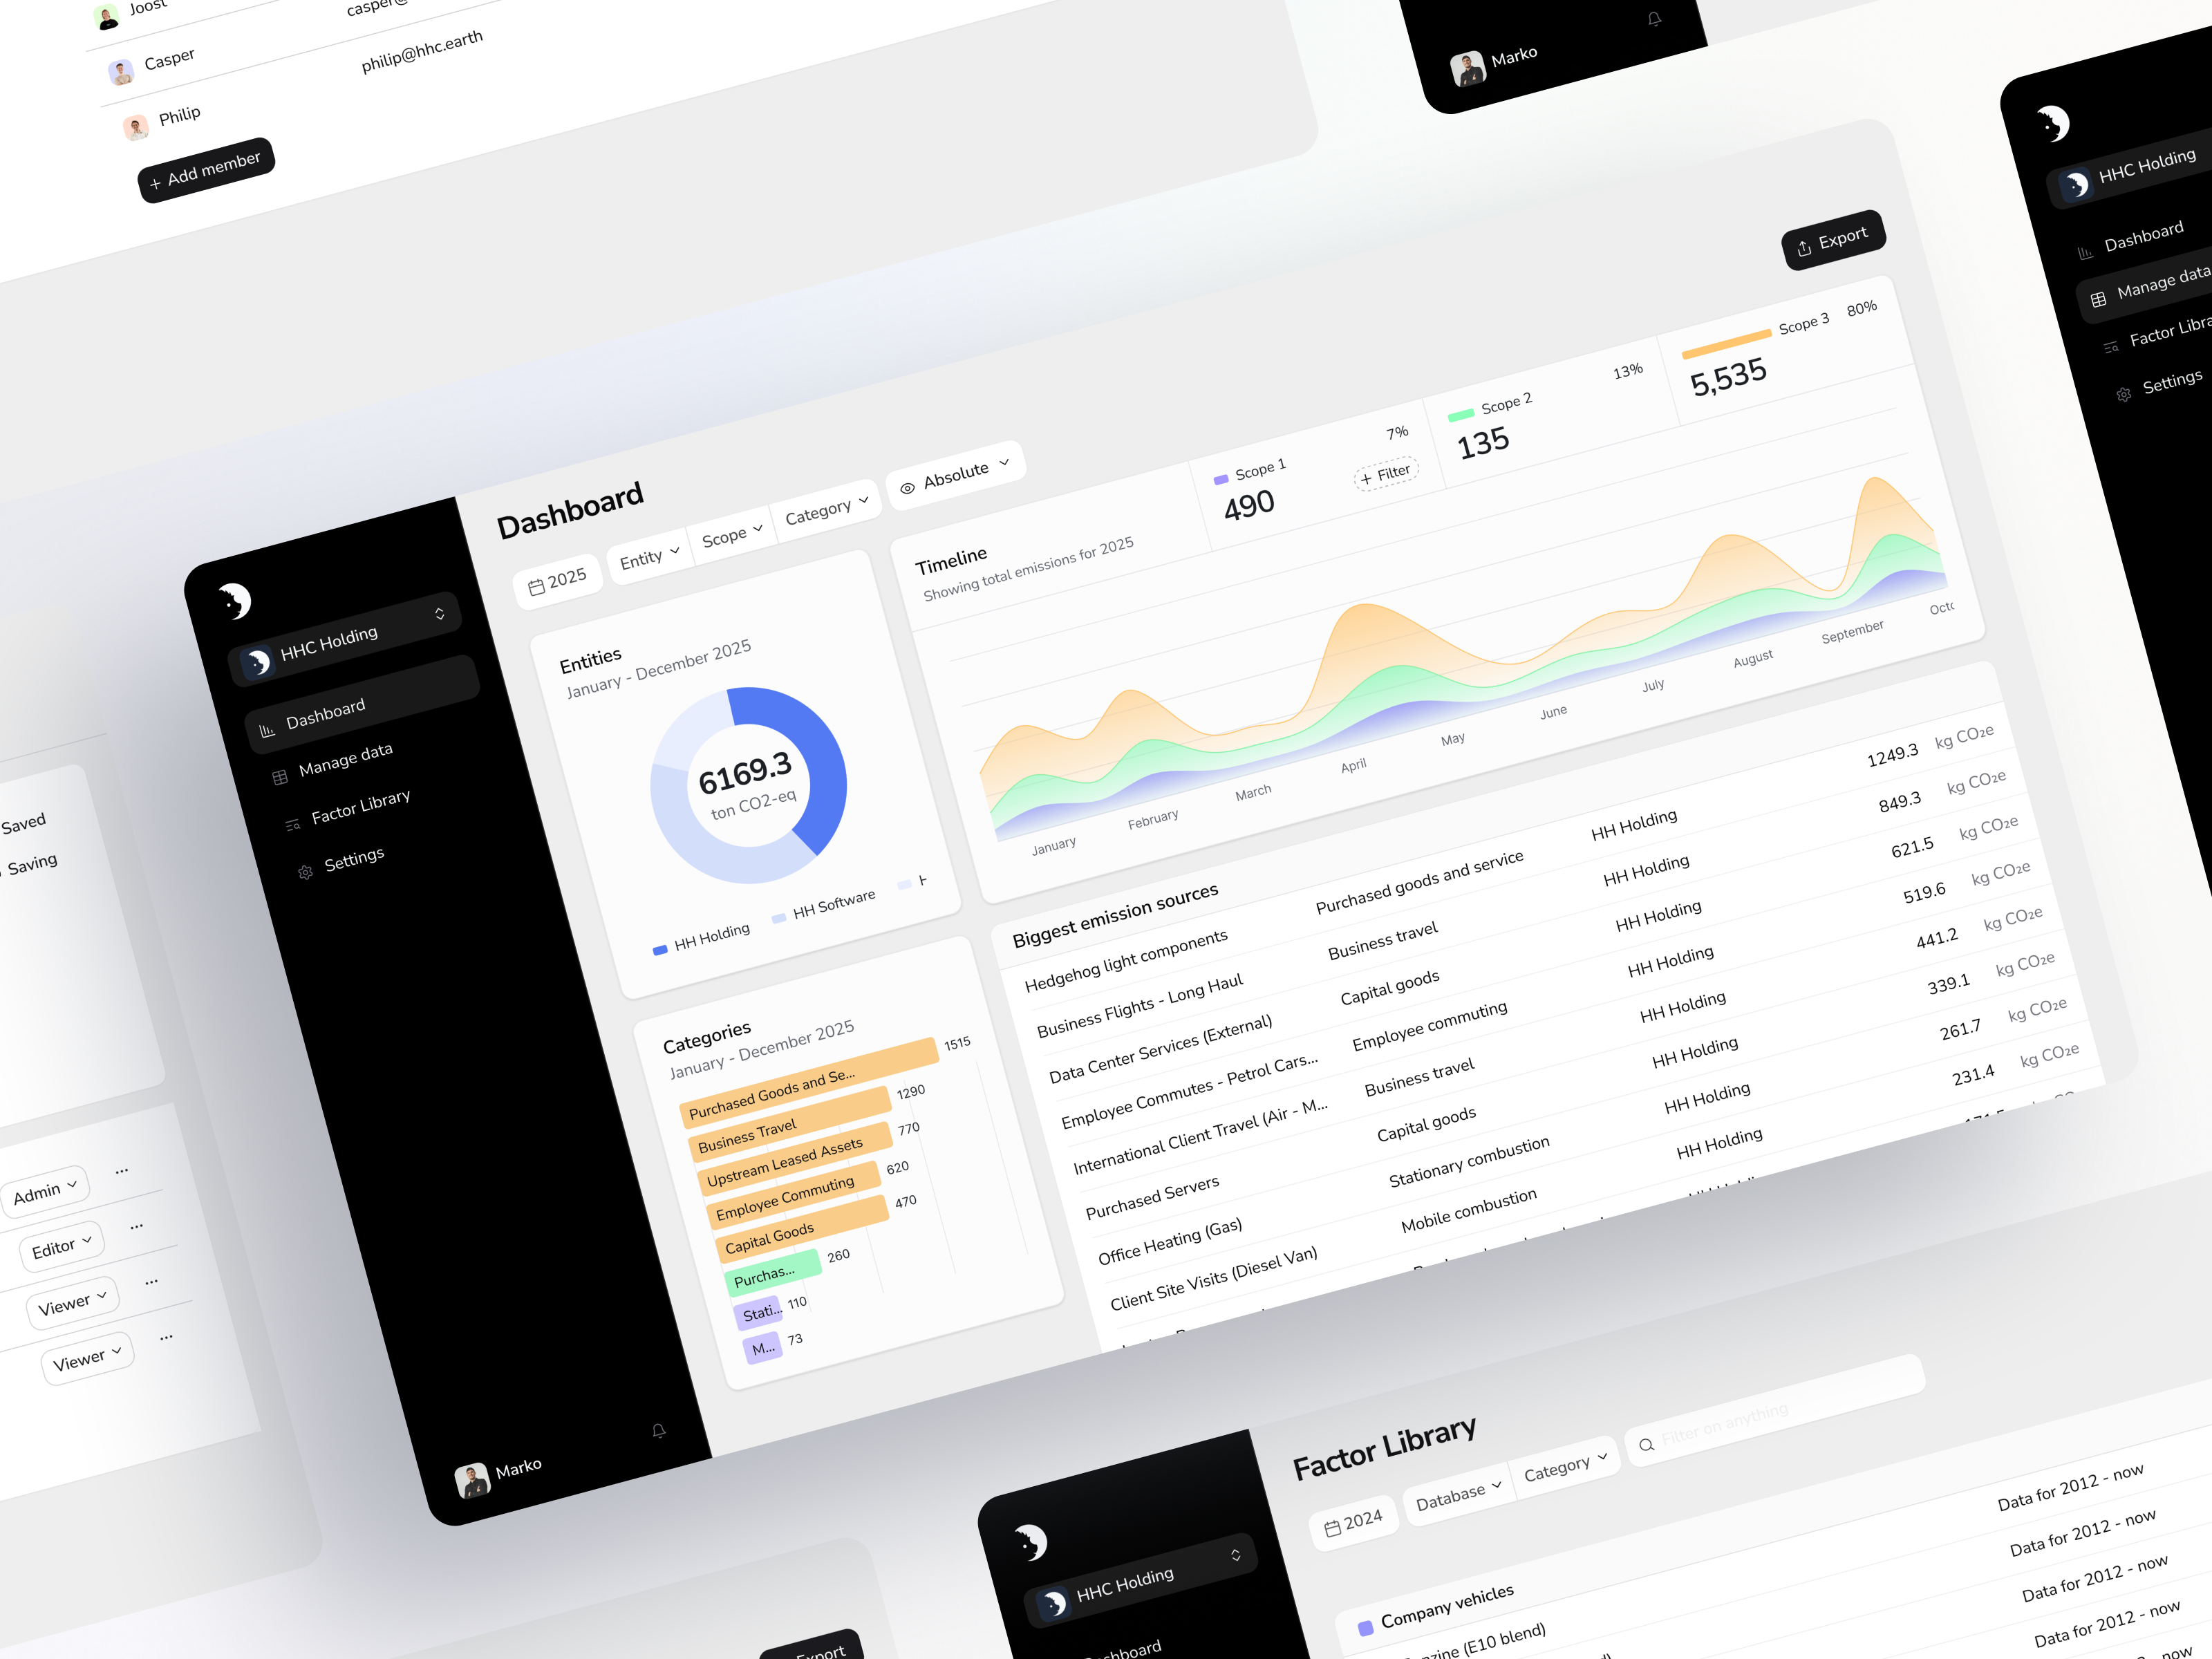
Scope 3 reporting can be a real burden as it covers everything from raw materials to how customers use your products. For an SME with limited resources, knowing where to start is often the biggest challenge. This is why a scope 3 upstream downstream analysis is critical – it helps you pinpoint emission 'hotspots' so you can focus your efforts where they matter most.
Understanding upstream vs. downstream emissions
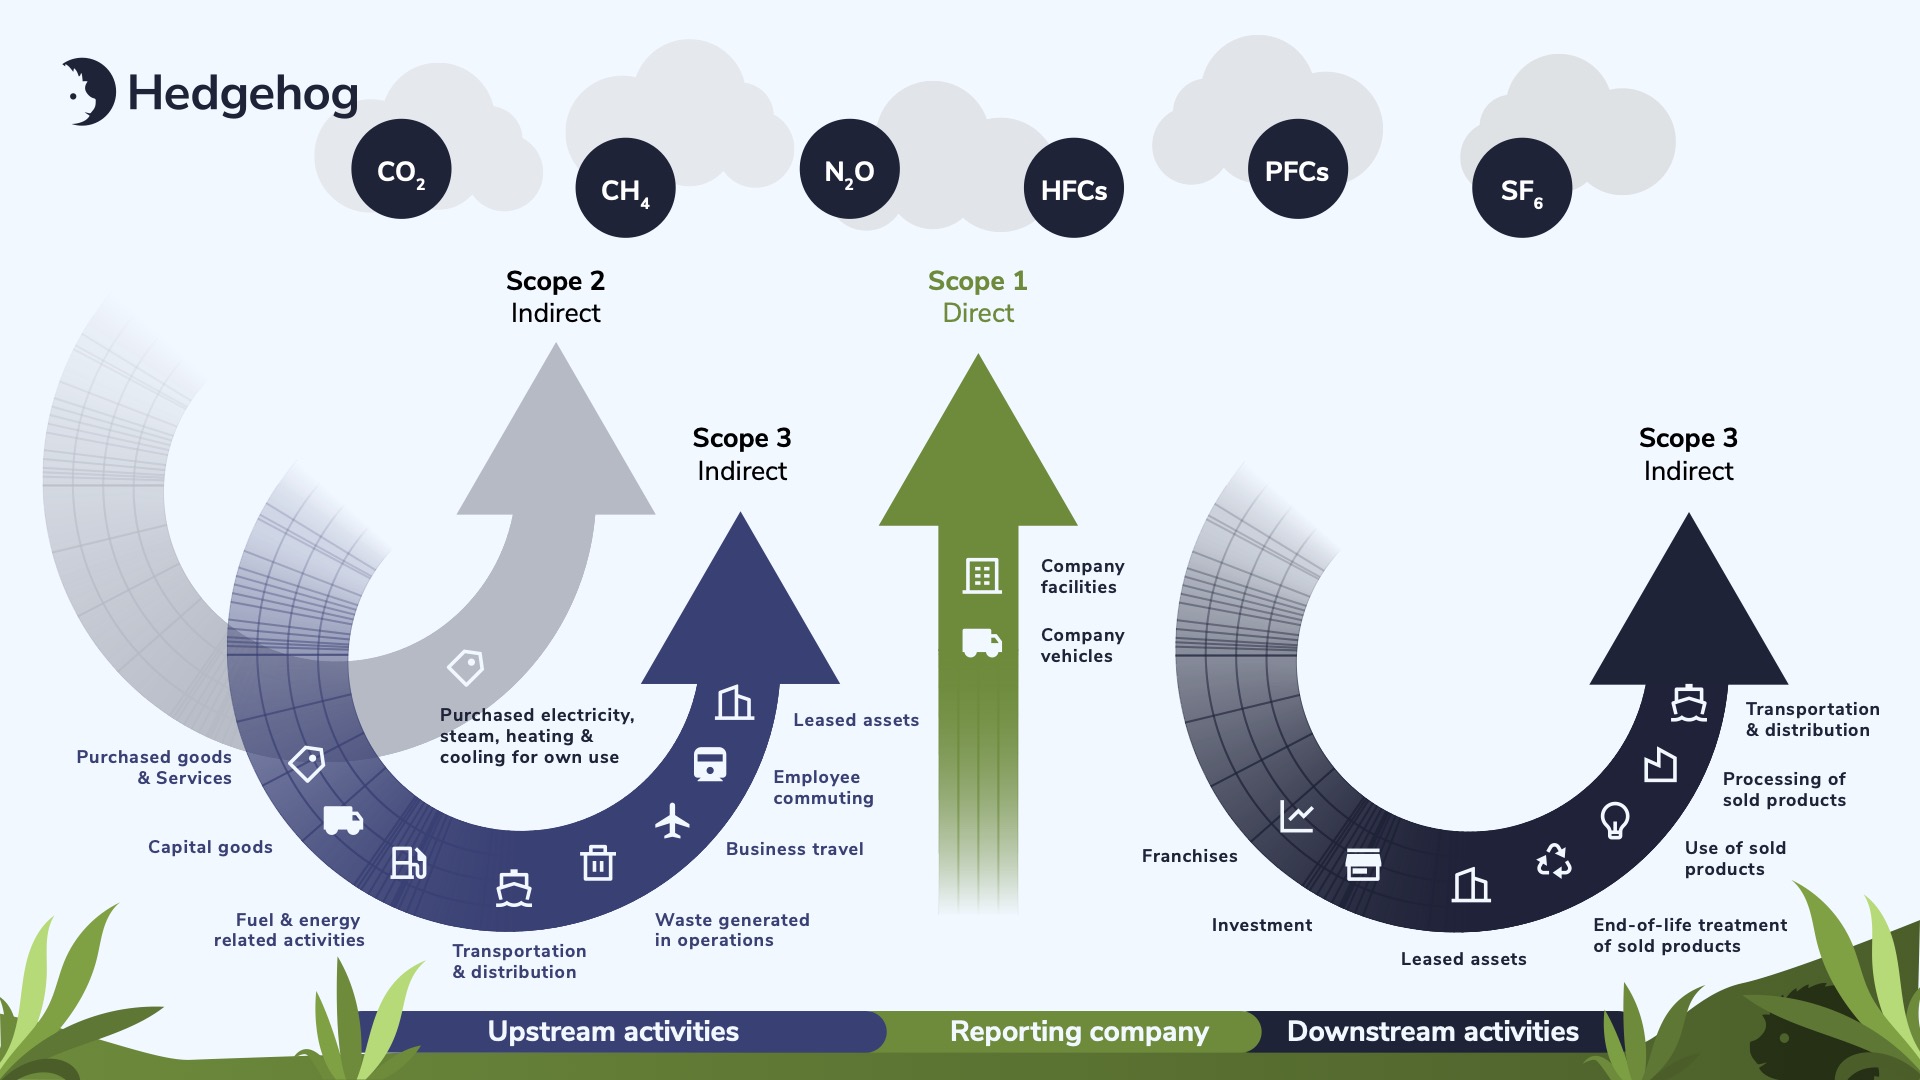
The GHG Protocol, the global standard for carbon accounting, divides scope 3 into 15 distinct categories, broadly grouped into two types: upstream and downstream. Think of your company's own operations as the dividing line.
Upstream emissions: these are the indirect greenhouse gas emissions related to the goods and services your company buys. They occur before your own operations, covering everything from raw material extraction to transportation of goods to your facilities. It's often referred to as your supply chain's footprint.
Downstream emissions: these are indirect greenhouse gas emissions related to the goods and services your company sells. They occur after your product or service leaves your control, including emissions from distribution, customer use, and eventual disposal. It represents the emissions impact of your product's entire lifecycle after it's sold.
Identifying upstream emission hotspots
For most SMEs, a few key upstream categories often account for the largest share of emissions. Focusing your initial scope 3 hotspot analysis here is a pragmatic first step.
- Purchased goods and services (category 1): this is frequently the largest source of value chain emissions, covering cradle-to-gate emissions of all products and services you purchase, from raw materials to office supplies and professional services.
- Capital goods (category 2): this category includes emissions from producing long-term assets like machinery, buildings, and vehicles that your company buys.
- Upstream transportation and distribution (category 4): these are the emissions from transporting goods from your direct suppliers to your facilities in vehicles you don’t own or operate, including third-party warehousing.
Identifying downstream emission hotspots
Downstream emissions can be just as significant as upstream, depending on your business. Understanding these hotspots is crucial for a complete picture of your impact.
- Downstream transportation and distribution (category 9): this covers emissions from transporting and distributing your sold products to customers in vehicles not owned or controlled by you, including retail and customer delivery services.
- Use of sold products (category 11): for companies selling products that consume energy during use (e.g., electronics), this is often the largest scope 3 category, accounting for all emissions generated during the product's active life with the end-user.
- End-of-life treatment of sold products (category 12): this accounts for emissions produced when your products are disposed of, including waste sent to landfill, incineration, or recycling processes. Designing for recyclability can directly influence this hotspot.
Practical methods for identifying your hotspots
Identifying your specific hotspots doesn't have to be overly complex. For SME carbon accounting, a few practical methods can provide the clarity needed to prioritise scope 3 emissions.
- Spend-based analysis: this common starting point involves multiplying your company’s purchasing data by industry-average emission factors. For example, the amount you spend on IT services is multiplied by a factor estimating emissions per euro spent in that sector. While not perfectly accurate, it’s an excellent way to quickly identify high-emission areas. Tools like the Hedgehog Carbon platform can automate this process.
- Supplier engagement: once you’ve identified potential hotspots with a spend-based analysis, engage with suppliers in those areas. Ask for their specific product-level emissions data (primary data) for more accurate insights and to signal that sustainability is a priority.
- Screening tools and databases: several tools can help you screen for emissions. The GHG Protocol offers a free scope 3 evaluator tool using industry averages. For more specific needs, working with a specialist can provide access to more granular data. For a more detailed look at different methods, see our guide on choosing the right carbon accounting method.
From hotspots to action: building your reduction strategy
Identifying your hotspots is the first step; the real value comes from taking action. Your scope 3 category breakdown provides a clear roadmap for your reduction strategy.
If your main hotspot is 'purchased goods and services', your strategy might involve engaging with key suppliers to encourage emission reductions, switching to low-carbon suppliers, or sourcing materials with higher recycled content.
If 'use of sold products' is your biggest impact area, you could focus on redesigning products for energy efficiency or educating customers on sustainable product use.
Connecting your analysis to a clear plan is where consultancies can provide significant value, helping you develop a robust carbon reduction strategy. Explore Hedgehog's carbon reduction consulting for support.
The strategic advantage of mastering scope 3 analysis
For SMEs, getting a handle on scope 3 emissions is no longer a 'nice-to-have'. It's a strategic necessity. A thorough scope 3 upstream downstream analysis transforms a complex challenge into a manageable plan. It allows you to focus your limited resources on actions that will make the biggest difference, reducing risk in your value chain and enhancing your brand's reputation.
By identifying and prioritising your emission hotspots, you are not just preparing for future regulations; you are building a more resilient, efficient, and sustainable business for the future.
Ready to demystify your scope 3 emissions? Contact Hedgehog for a free consultation or try our Carbon platform to start your hotspot analysis today. Our experts in scope 3 consulting can guide you through every step.


.webp)