
In short
- Iron, steel and aluminium are named CBAM sectors, which turns your supplier's emissions into a cost line in your business.
- Embodied carbon in the input material is the number. The scrap ratio drives it.
- Mill certificates are the evidence base, and they are the part most metals firms have never digitised.
Metals is one of the few sectors with a rule aimed straight at it. Iron, steel and aluminium are named CBAM sectors, so the carbon content of what you buy is becoming a cost rather than a disclosure. Almost none of your footprint is made on your own site: it is embodied in the input material, and the scrap ratio of that material drives the answer more than anything you can change in your own works. The software therefore has to hold material-level data, accept a real figure from a mill certificate in place of a generic average, and show its working when somebody checks.
Which rule actually bites for metals, and when?
CBAM, and it bites through your supply chain rather than through a reporting deadline.
Iron, steel and aluminium are named CBAM sectors. If you import covered goods, weigh your annual tonnage first: a 50-tonne-a-year de minimis threshold, introduced by Regulation (EU) 2025/2083, exempts an importer whose cumulative net mass of CBAM goods stays below it, and the Commission's own figure is that this takes roughly 90 percent of importers out of the regime entirely while keeping about 99 percent of embedded emissions in scope. Above that line, the obligation is directly yours. Below it, or if you buy from someone who is above it, or sell to someone who is, the cost of the carbon embedded in that material still starts appearing in quotations and contract terms, which is a faster and more concrete signal than any reporting requirement. Our CBAM explainer sets out how the mechanism works, including the threshold.
The practical consequence for a commercial or technical lead is that carbon becomes a procurement variable. Two suppliers quoting the same tonnage at the same price are no longer offering the same thing, and you need a number per supplier and per grade to see the difference.
Why does the scrap ratio decide your number?
Because in metals the input material is the footprint, and how that material was made is the single largest variable in it.
Everything else you can influence, the energy you use to cut, form, coat and finish, sits on top of a number that was already fixed before the material reached your gate. This is why a metals footprint built from your own energy bills looks reassuringly small and is close to meaningless as an answer to a customer.
It also explains why generic averages fail you commercially. A national or European average factor for steel gives every supplier the same score, which erases exactly the difference you are trying to demonstrate. The whole value of the exercise is in replacing the average with the actual, per grade and per mill.
Where does the data come from?
Three sources, and they are unusually unequal in effort.
| Source | What it evidences | Effort | Why it matters |
|---|---|---|---|
| Input material certificates | Grade, origin and the mill's own emissions data | High, they arrive as PDFs and nobody has structured them | This is the number your customer wants |
| Mill data | Route and process behind the material you buy | Medium, depends on the supplier relationship | Distinguishes one supplier from another |
| Energy meters | Your own processing, forming and finishing | Low, it is on the bill | Completeness, not magnitude |
The order in that table is the order of value and the reverse of the order of ease, which is the whole difficulty of the sector. Most metals businesses start with the energy meters because it takes an afternoon, then stall on the certificates because they are a filing problem before they are a carbon problem.
What does a metals tool have to produce?
Four things, and only the first is standard across carbon software.
An organisational footprint. Scope 1 and 2 from your own works, scope 3 from purchased material. This is the base and it is the easy part.
Material-level detail with supplier-specific factors. You need to record steel from mill A separately from steel from mill B, at their real figures, and see the difference in the total. A platform that only takes a spend figure against a category cannot do this.
Traceability from the reported number back to the certificate. CBAM-adjacent conversations are checked. When a customer or an auditor asks where a figure came from, you need to land on a document, not on a category name.
A per tonne or per grade intensity. Absolute tonnes are not the currency of a metals negotiation. Intensity is.
What can a carbon platform not do here?
It cannot produce a product declaration. That distinction is worth being blunt about, because metals customers routinely ask for one.
An organisational footprint tells your customer what your business emitted. An EPD or a product carbon footprint tells them what one tonne of one product carries, calculated to a standard, usually reviewed. That is LCA work with its own methodology and its own evidence burden. At Hedgehog, LCA, EPD, MKI and PCF are delivered as a service. The platform does organisational footprints. Knowing which one you have been asked for saves a wasted procurement cycle.
What does Hedgehog do for a metals business?
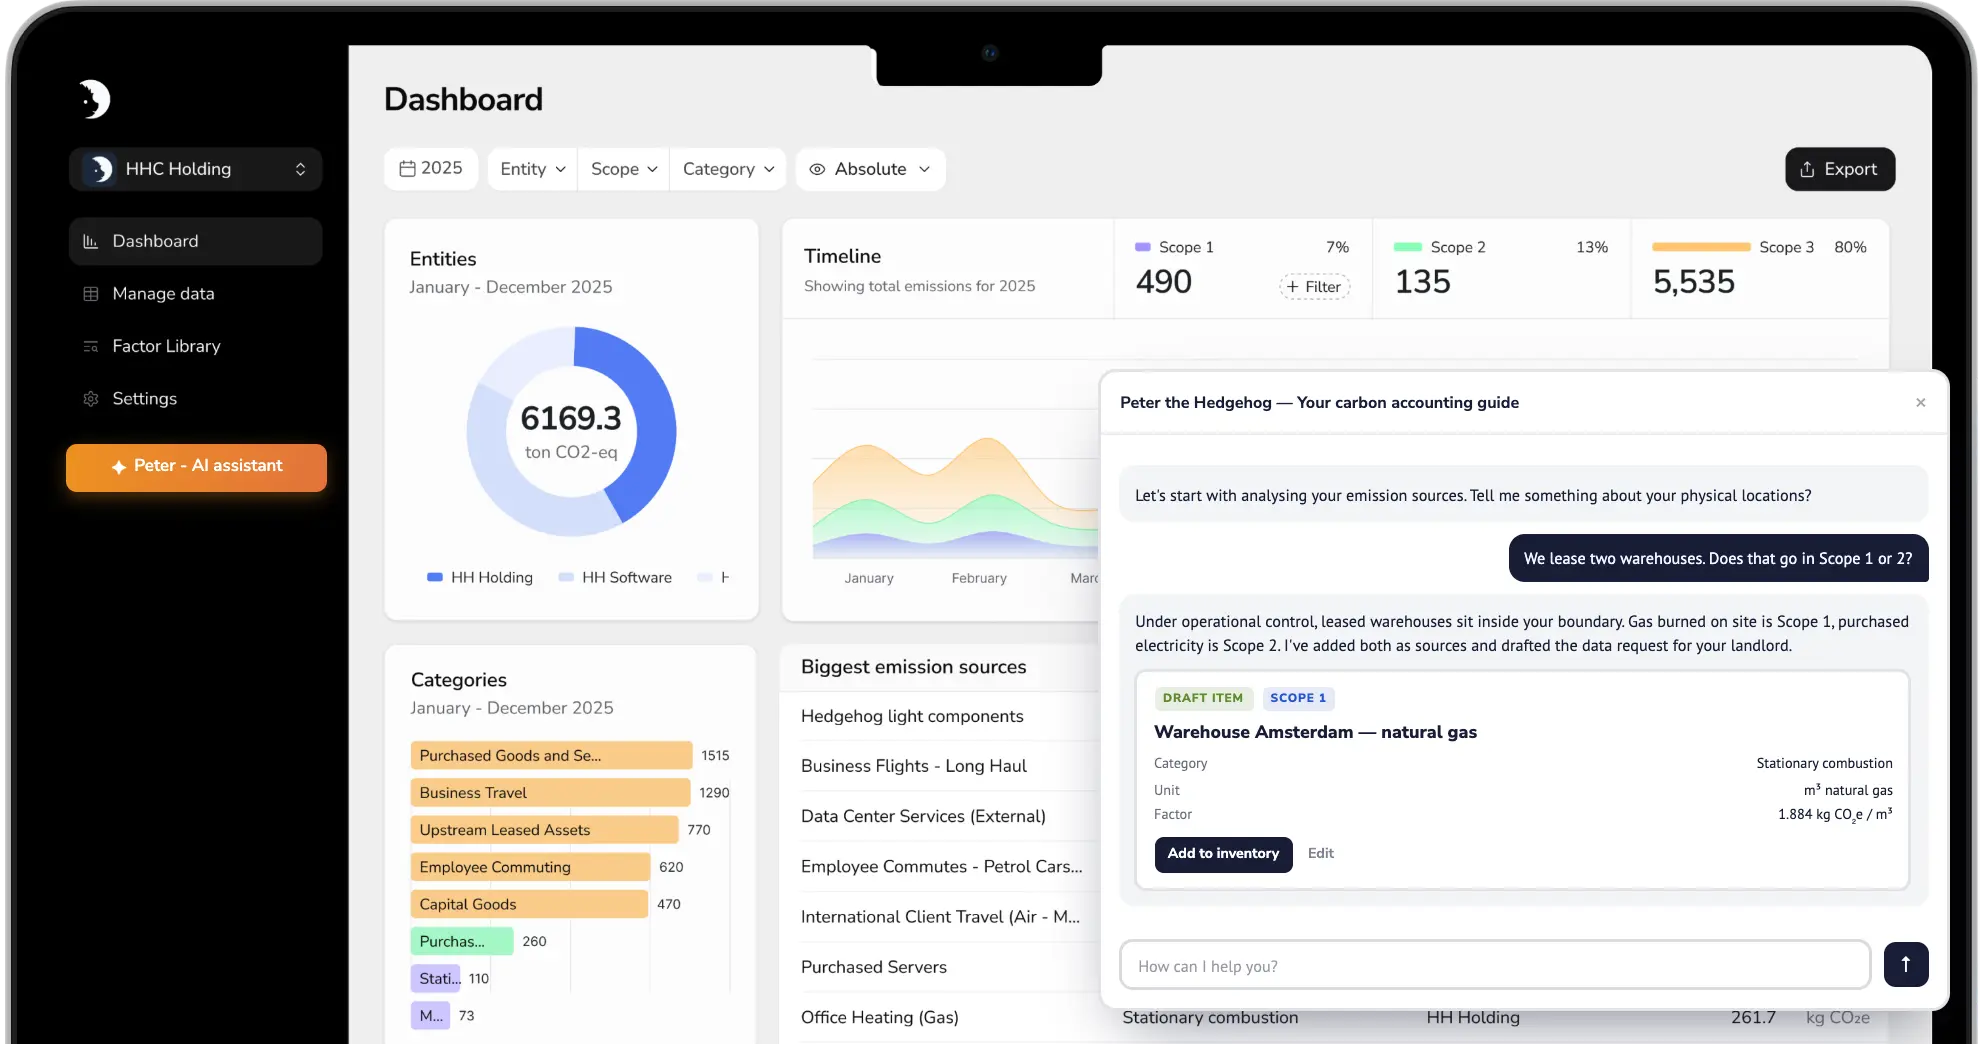
The platform guides you through GHG Protocol setup, data collection planning and inventory building, with an AI assistant for setup and human GHG experts reachable in the product. It holds more than 20,000 spend-based and activity-based factors and, more usefully for this sector, lets you add your own organisation-specific or supplier-specific CO2 data. That is the mechanism for putting a mill's real figure against a grade instead of an average. Entity management covers multiple sites, with user roles for data owners, auditors and managers. It is rated 4.7 on G2 from 9 reviews. Free account with no sales call, Pro from EUR 1,200 a year.
Three limits you should weigh, all from paying customers on a public page.
Traceability of applied conversions is not complete. A reviewer on G2, mid-market segment, said in July 2026 that they could not see which conversion factor or distance calculator had been applied to turn their input into a platform entry, and asked for a link to the source. In a sector where the whole point is evidencing which figure came from which certificate, that is a limitation to test against your own case before you commit.
Loading the data takes real effort. A reviewer on G2, small business segment, said in August 2026 that once the data is in everything works perfectly and getting it loaded is the challenging part. Structuring years of mill certificates is exactly that kind of work.
Product footprints are a service. Stated above, and worth repeating because it is the most common mismatch in this sector. If the request is for a declaration per tonne of product, that is consultancy, not a subscription.
Where should you start?
Pull your purchase data for the last twelve months and rank material by tonnage rather than by value. That ranking is your project plan, because the top few grades will carry most of the answer.
Then ask your three largest suppliers for their emissions data per grade, in writing. Their answers, or their silence, tell you more about how hard this will be than any software trial will. If you are also fielding customer questionnaires while you do it, scope 3 support is where that work sits.
You can start a free account and build the organisational base from your energy data first, then layer material on top as the certificates come in.
Sources: Hedgehog platform, Hedgehog on G2, Regulation (EU) 2023/956 as amended by Regulation (EU) 2025/2083, and the European Commission's CBAM page. G2 and platform facts verified 27 August 2026; CBAM facts verified 17 September 2026. CBAM scope and dates are due for re-check before any 2027 refresh.
Facts on this page were last verified on 2026-09-17.